Major Market Indicators Report June 2020: Downshifting To Neutral
by Singular ResearchSummary
- U.S. equity markets stage a V-shaped recovery as our indicators shift down to neutral.
- Our risk adjusted fair value target on the S&P 500 is 3,080, representing an increase of less than 4%.
- While market sentiment technicals and monetary indicators are positive, valuation, liquidity, and earnings momentum are suspect.
June 2020 MMI ReportTo the amazement of pundits, professionals, and everything in between, U.S. equity markets have stormed back from the abyss of the Corona virus to the perspective sunny days of an economy that looks to spring back after an imposed shutdown.Sentiment: Bullish
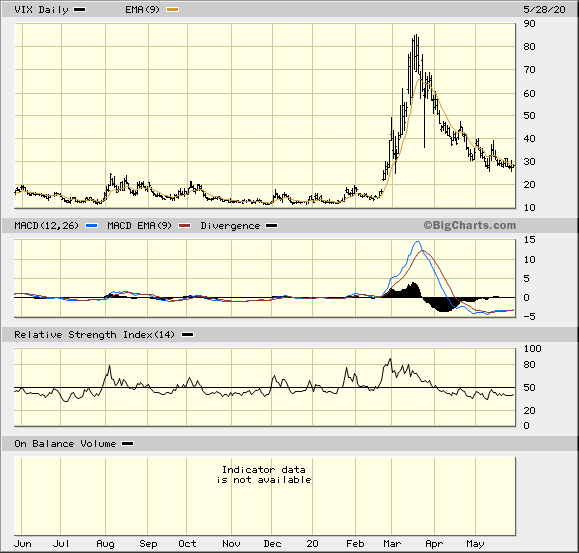
The VIX is still at elevated levels though down from the highs at +28. The Put/Call ratio is high at 1.32 and the Arms index on the NYSE is elevated at 1.65. These reading reconfirm elevated levels of fear.
Exhibit 1: VIX 1-Year Chart

Technical Indicators: Neutral
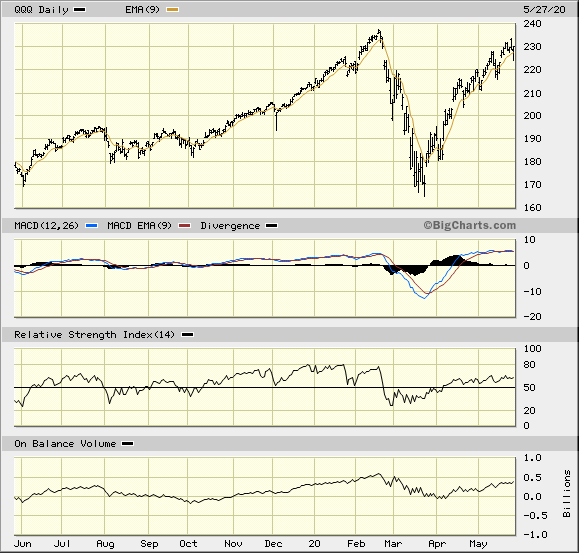
The NASDAQ is well above its 200-day moving average, followed by the S&P 500 which this week has pierced above its 200-day moving average. While broader, equal weighted indices for small and large caps are lagging, they are too bouncing back, finally with vigor. The S&P Small Cap 600 Equal Weight index is only 7% below its 200-day moving average.Liquidity Indicators: Neutral
Money market funds still exceed $3 trillion, a healthy amount of cash still parked for possible future deployment in equities while effectively earning zero percent. Margin credit balances have increased to 41% up from 34% two months ago. With capital raising still in lockdown mode, share buybacks and M&A are showing signs of life, adding over $9 billion of capital inflows in May. While this inflow is at improved levels, the amount is still below the $20 billion monthly minimum in capital inflows that we require to register a bullish sign for liquidity.
EPS Momentum: NegativeYear-end S&P EPS have been reduced to $129, a decrease of nearly 20% since last December. Quarterly forward EPS estimates look for a decline of (43)% in Q2, abating to a decline of (24)% in Q3. Earnings are expected to rebound in 2021 by over 12%. The forward PE ratio on the S&P 500 is over 21 times, a significant premium over its 10-year average of 15.5 times.Valuation: Negative
Our risk adjusted fair value target on the S&P 500 is 3,080, representing an increase of less than 4%. Total market cap to GDP is now 1.4 times, an elevated level. The earnings yield provides a 130-basis point spread to the corporate yield. Currently, this spread is the one positive valuation indicator.
Exhibit 2: QQQ ETF 1-Year Chart

Monetary Indicators: BullishM2 is up 17.2%. The Fed opened the spigot to fill the Corona virus induced gap. Our excess liquidity indicator scores at a +253, meaning the Fed is still stepping on the gas. The term spread in the treasury market is +60 basis points and high yield bonds provide a 473-basis point premium to 10-year treasuries which is positive.
In summary, our indicators have reached a stalemate. While market sentiment technicals and monetary indicators are positive, valuation, liquidity, and earnings momentum are suspect. Caution is warranted and profit taking is suggested.
Robert Maltbie, CFA
President, Singular Research
818-222-6915
Trial Subscription Offer: Home - Singular Research
Best of the Uncovereds offers new initiation reports on roughly two dozen companies per year, with a focus on under-followed small and mid caps with significant potential. We provide a quarterly earnings update reports on all companies covered, as well as flash reports on significant news announcements by companies. We go further for members, providing recorded interviews with management teams of covered companies when available and a monthly quantitative based "Market Indicators and Strategy Report."
Disclosure: I/we have no positions in any stocks mentioned, and no plans to initiate any positions within the next 72 hours. I wrote this article myself, and it expresses my own opinions. I am not receiving compensation for it. I have no business relationship with any company whose stock is mentioned in this article.