The Markets End The Week In An Uptrend (Technically Speaking For 5/25-5/29)
by Hale StewartSummary
- The leading indicators points toward a continued contraction.
- The coincidental data shows the sharpest contraction in the last 100 years.
- The overall trends remain higher.
This week, I'm returning to my previous Friday format, which has two parts. The first looks at the US economy using the long-leading, leading, and coincidental indicator format developed by Arthur Burns and Geoffrey Moore of the Federal Reserve. The second looks at the charts of the major ETFs that track the broader markets.
It should come as no surprise that, due to national lockdowns, the US economy is now in a recession. We're now looking for "green shoots" -- signs that the economy will resume growth. With the exception of the stock market, there are none in the current data.
Leading Indicators
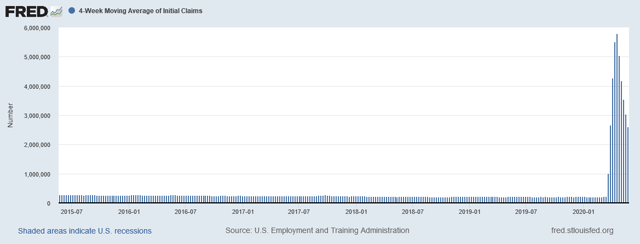
The labor market is now in terrible shape:Over the last eight weeks, the number of people filing for first-time unemployment benefits has increased to over 40 million. That, unfortunately, doesn't tell the full story. The Chicago Fed has created a COVID-related unemployment rate, which predicts the unemployment rate is actually between 25%-34%.
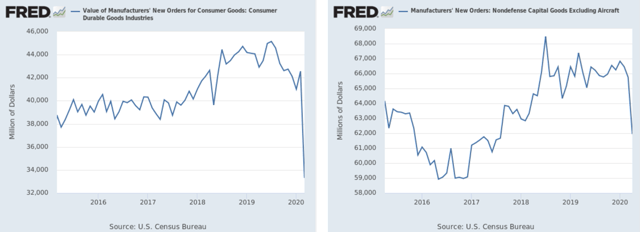
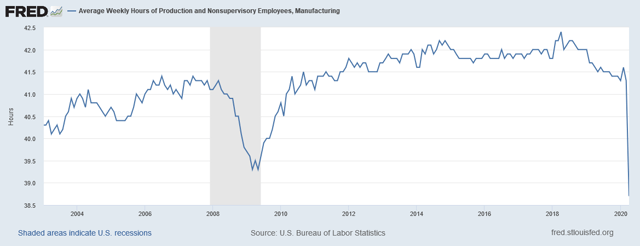
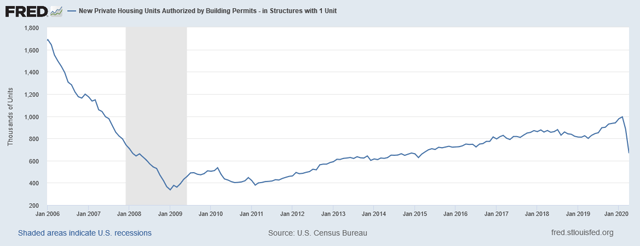
Other leading indicators show continued contraction:New orders for consumer durable goods and non-defense goods excluding aircraft are declining sharply.The average weekly hours worked by manufacturing employees are below levels from the last recession.Housing permits have declined sharply.
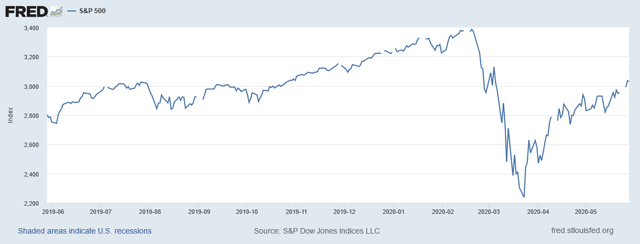
The only good news is the stock market; its advance indicates traders are expecting growth to return quickly.
Leading indicator conclusion: all of the data is pointing towards continued contraction. Only the stock market is predicting any level of growth.
Coincidental indicators
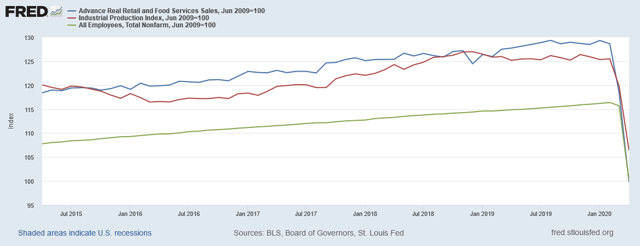
This chart sums up the depth of the current contraction:The above chart shows real retail sales (in blue), industrial production (in red), and payroll employment (in green). All three have been converted to a base 100 format, using the end of the last recession (06/09) as 100. Over three have cratered due to the lockdowns.
The New York Fed has created a high-frequency indicator to show the current level of four-quarter GDP growth:
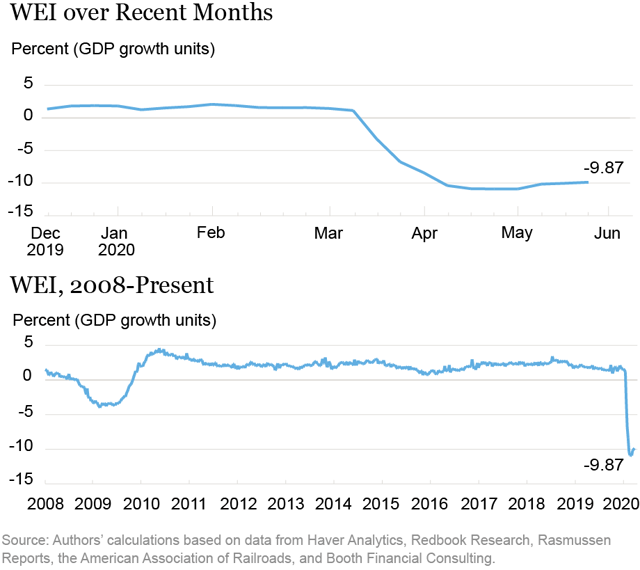
This is in-line with other forecasts.
On Friday, the BEA released the latest monthly personal consumption expenditures data:
Personal income increased $1.97 trillion (10.5 percent) in April according to estimates released today by the Bureau of Economic Analysis (tables 3 and 5). Disposable personal income (DPI) increased $2.13 trillion (12.9 percent) and personal consumption expenditures (PCE) decreased $1.89 trillion (13.6 percent).
Incomes increased thanks to the stimulus programs passed by Congress. For the second month in a row, expenditures are down sharply:
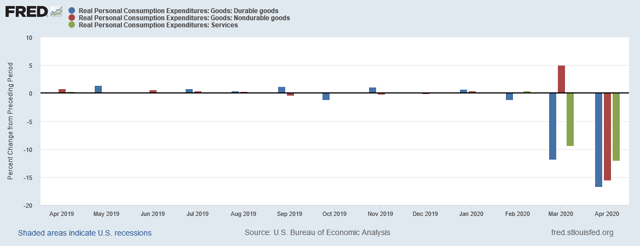
For most of April, a large majority of the country was under some type of lockdown/quarantine order, which explains the drop.
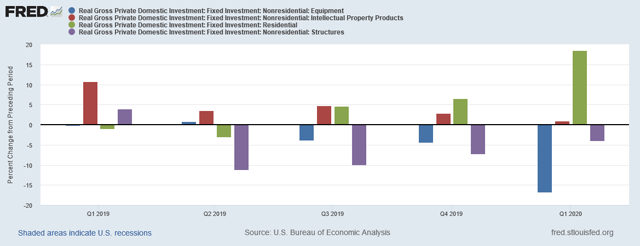
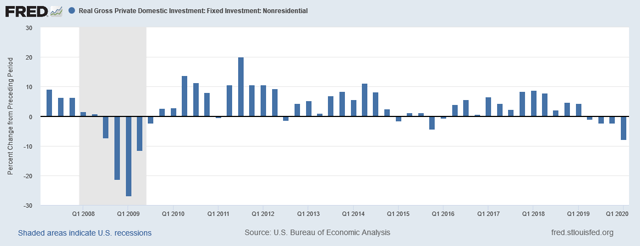
On Thursday, the BEA released the latest GDP report, which was revised a bit lower to -5%. The PCE data above is more current. However, the investment component of the GDP report showed a big slowdown:Interestingly, residential investment (in green) continues to increase. This is a good sign since the housing market is usually a large component of an economic recovery. Equipment spending (in blue) dropped sharply; intellectual property spending (in red) -- which is usually pretty steady, even in a recession -- was weak. Overall, business investment has taken a huge hit.Total business investment has declined in the last four quarters; the pace of the decline is accelerating.
Conclusion: the above data is very clear: the leading indicators predict more contraction while the coincidental indicators show the breadth of the slowdown. This will likely be a far worse recession than the Great Recession.
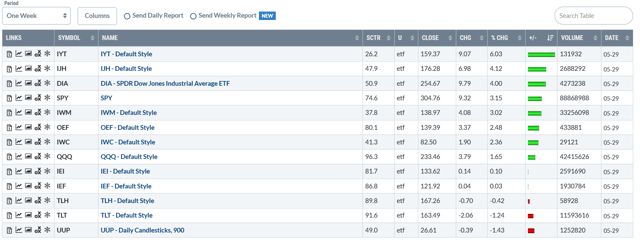
Let's look at this week's performance tables:
This was a good week for the markets. The mix of indexes is a bit odd; mid-caps are the second-best performer, followed by the Dow and SPY. The intermixing of small and large-cap stocks continues for the rest of the list.
Over the last week and month, there's been a shift in the equity index performance:
| Week | Month | Quarter | 1/2 Year | |
| 1st | IJH | IJH | QQQ | QQQ |
| 2nd | IWM | QQQ | OEF | OEF |
| 3rd | IWC | IWC | SPY | SPY |
Data from Finviz.com
Over the last week and month, smaller-cap indexes have rallied.

Before looking at the charts, remember that the inter-market analysis is still showing a recession:Commodities (left) are at the bottom of their 52-week range, while Treasuries (second from left) are at the top. Equity markets believe the economy will rebound quickly, which explains the rally in the SPY.
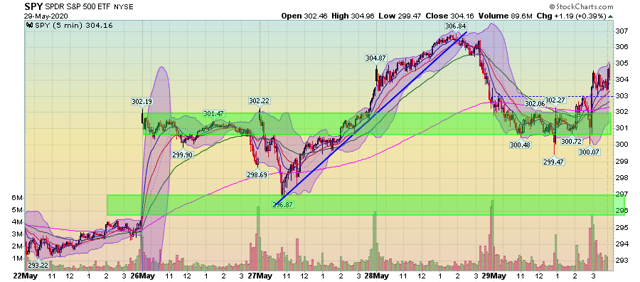
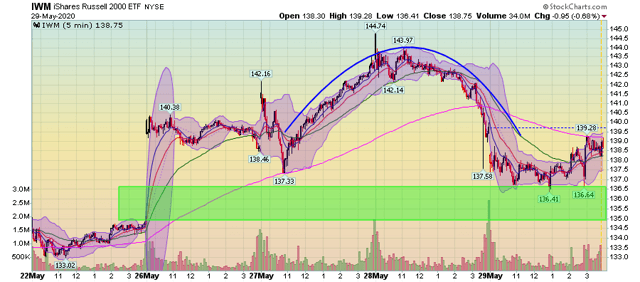
Let's start with a look at the 5-day SPY chart.Markets gapped higher on Monday, which accounts for most of the week's gains. There was a decent rally on Tuesday and Wednesday, which prices broke on Thursday. Small-caps formed a rounded top on Wednesday and Thursday. They closed near their Monday AM opening price.
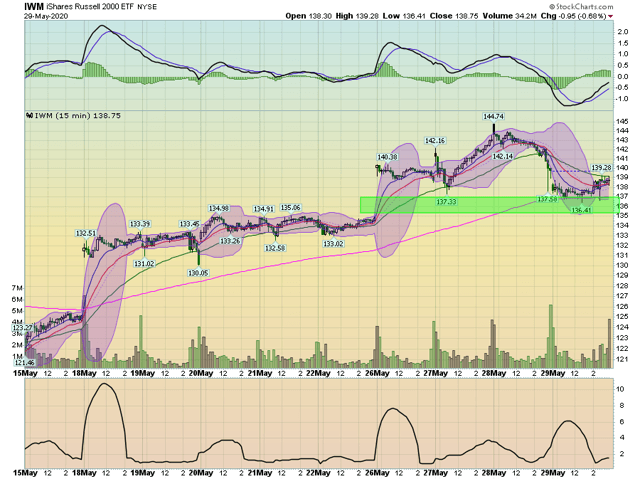
The 2-week charts show that over the last two weeks, prices have gapped higher on Monday, ending the week near their Monday starting price.
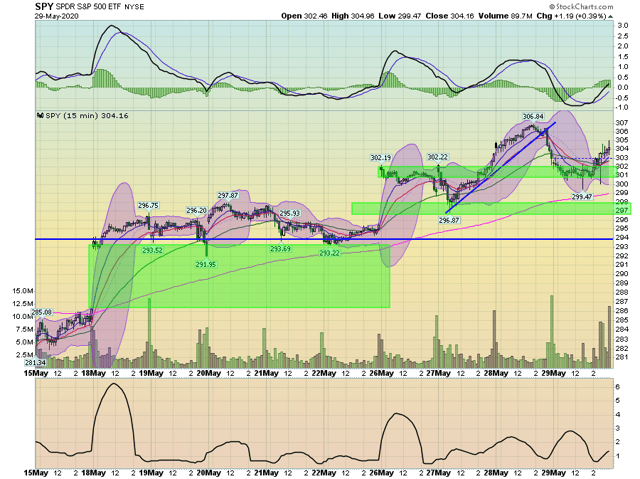
The pattern exists in the SPY ...
... and IWM.
Finally, smaller-caps continue to cluster around their respective 200-day EMAs.
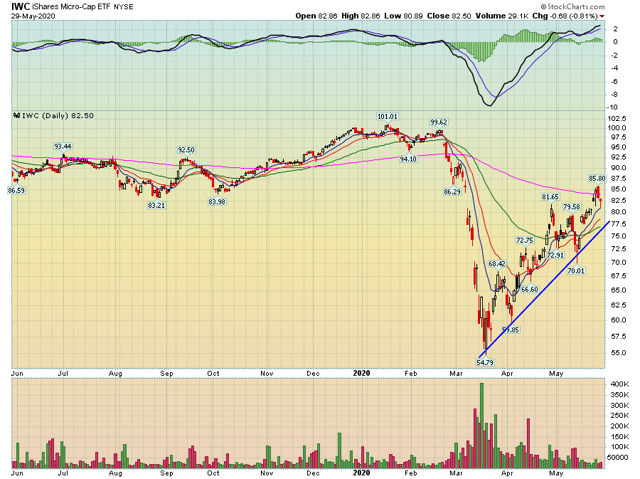
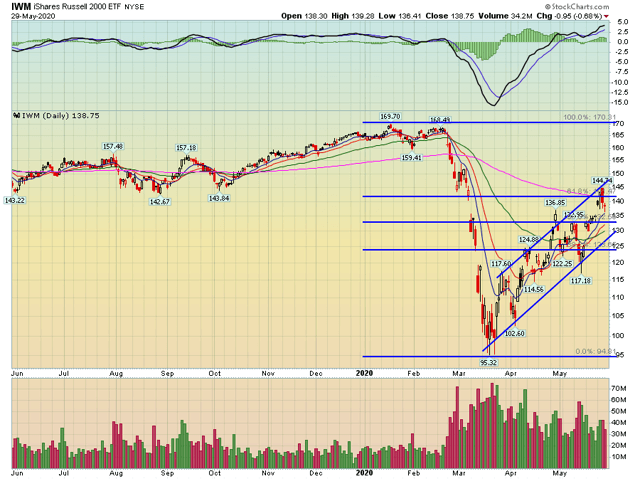
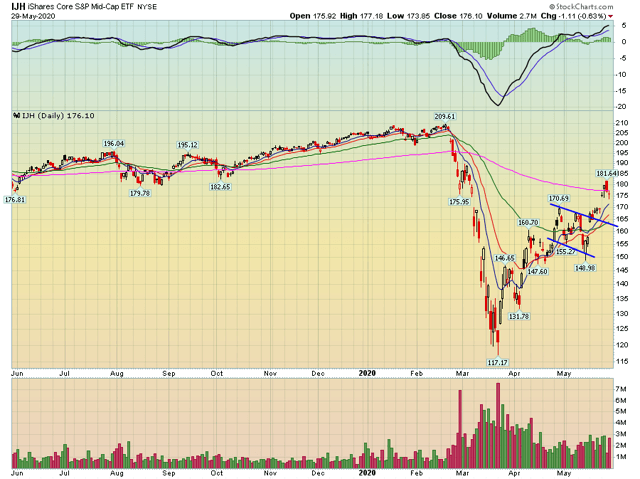
Micro-caps are just below the 200-day EMA, as are ... .... small-caps ...... and mid-caps.
Overall the markets continue to grind higher, largely thanks to already passed stimulus and the promise of more spending. The fact that the country is emerging from lockdown helps as well. The next big challenges are earnings season along with the possibility of a second or third wave of infections.
But for now, things are good.
Have a good weekend.
Disclosure: I/we have no positions in any stocks mentioned, and no plans to initiate any positions within the next 72 hours. I wrote this article myself, and it expresses my own opinions. I am not receiving compensation for it (other than from Seeking Alpha). I have no business relationship with any company whose stock is mentioned in this article.