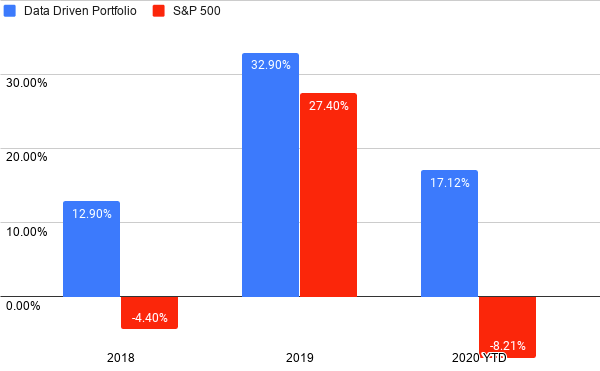
Screening For Growth Leaders With Outstanding Profitability
by Andres Cardenal, CFASummary
- Investing in growth leaders can be great, and investing in growth leaders with attractive profitability can be even better.
- Presenting a screener that selects companies with above-average growth rates and elevated return on investment.
- This screener can miss many of the most explosive growth stocks in the market, and valuation is always an important consideration to keep in mind.
- Nevertheless, it provides a nice combination of growth and quality.
- As always, the screener shows a list of potential ideas for further research as opposed to a series of recommendations.
Investing in leading growth stocks can be great, and investing in leading growth stocks with attractive profitability can be even better. The following paragraphs are introducing a quantitative screener focused on companies with superior growth rates in revenue and strong profitability metrics as measured by return on investment - ROI.
The main idea is actually quite simple. We are looking for companies that consistently outperform their peers in terms of revenue growth, and we also want these companies to make big profits on each dollar of investor capital.
No formula can guarantee success by any means, but it makes sense to expect solid fundamentals among companies with a strong combination of revenue growth and profitability levels.
Building The Screener
To begin with, it is important to understand that a screener is not a list of recommendations. Far from that, a screener is only the first step in the idea generation process. The research process begins with the screener, it hardly ends there.
The only reason why I show the backtested performance data for the screener is that it can be illustrative to see what kind of performance this strategy would have produced in the past. But past performance does not guarantee future returns at all. This disclaimer has been repeated ad nauseam, which doesn't make it any less true.
Those considerations being acknowledged, the screener is based on a set of simple considerations.
- Only companies with a market capitalization value above $500 million are considered. This can actually hurt returns because the smaller companies are many times the most dynamic growth stories, but it still makes sense to keep overall size above a particular level for risk management purposes.
- The company needs to have positive sales growth in the past five years, in the past twelve months, and in the past quarter. This obviously excludes many low-quality businesses from the investable universe.
- The company needs to have revenue growth rates above 50% of its industry in the past 5 years, the past 12 months, and the past quarter. We are looking for companies that can outperform their peers consistently because this reflects fundamental strength.
- Return on investment has to be over 20% in the past 12 months and also in the past 5 years. This is a very demanding requirement, so the screener selects only companies with world-class profitability levels.
- Among the companies that meet the criteria above, the screener selects the 30 names with the highest ROI ratio.
Leaving the numerical considerations aside, the concept is quite straightforward. The screener is looking for companies that consistently outperform the competition in terms of revenue growth and also make huge profits on invested capital.
The backtest picks the 30 stocks selected by the quantitative screener and it builds an equally weighted portfolio. The portfolio is rebalanced annually since it is based on long-term factors and it doesn't require too much rotation. Trading expenses are 0.2% per transaction and the benchmark is SPDR S&P 500 (SPY).
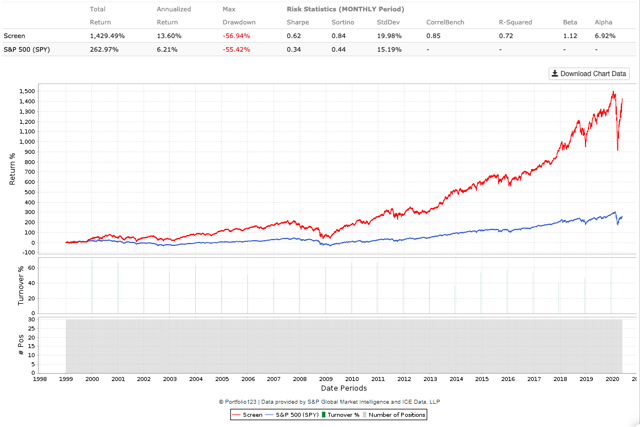
Since 1999 the screener produced a cumulative gain of 1429% versus 263% for SPDR S&P 500. In annual terms, this means 13.6% for the screener versus 6.21% for the benchmark. Alpha for the quantitative screener amounts to 6.92% per year.

Data from S&P Global via Portfolio123
The table below shows returns and risk-adjusted return metrics for the quantitative screener versus the benchmark over different periods. The backtested results are consistently good, but this is due to the market regime over the past two decades.
Big and profitable growth stocks have performed particularly well in recent years, and the screener is focused on those kinds of names. In a different market context, the results would have been very different.
For example, in a period in which cheap and beaten-down stocks are doing much better than high-quality growth stocks, the screener can be expected to significantly underperform the benchmark.
| Screen | SPY | |
| Annualized | 13.60% | 6.21% |
| One Month | 15.58% | 3.52% |
| Three Month | 1.31% | -1.99% |
| One Year | 16.50% | 10.56% |
| Three Year | 70.91% | 33.12% |
| Five Year | 103.04% | 58.86% |
| Total | 1429.49% | 262.97% |
| Sharpe Ratio | 0.62 | 0.34 |
| Sortino Ratio | 0.84 | 0.44 |
| Max Drawdown | -56.94% | -55.42% |
| Standard Deviation | 19.98% | 15.19% |
| Correlation | 0.85 | - |
| R-Squared | 0.72 | - |
| Beta | 1.12 | - |
| Alpha (annualized) | 6.92% | - |
Data from S&P Global via Portfolio123
Practical Considerations And Results
Selecting stocks based on quantitative variables has many advantages versus a more discretionary approach. Importantly, a quantitative screener can avoid many of the most expensive mistakes that investors typically make by relying too much on opinions, emotions, and speculation.
However, the method itself has some serious limitations too. By its own nature, the quantitative screener is based on past data, and investors need to do their homework in order to analyze if the companies on the screen can sustain their financial performance going forward. The numbers alone don't tell the whole story, it is important to analyze the business behind those numbers in order to tell if the numbers are sustainable.
Focusing on a combination of growth and profitability can also leave aside many of the most explosive growth stocks in the market. Companies that have particularly abundant opportunities for growth tend to reinvest a large share of their income, so many times they are losing money on a GAAP basis.
Profitability can be a very good thing to have, but many times the companies with the best long-term growth potential are relatively young and unprofitable in the present time. By including profitability in the equation, the screener will certainly miss many of the most vigorous growth opportunities.
Valuation is the other side of the coin. A company with superior growth and attractive profitability certainly deserves an above-average valuation level. Nevertheless, even the best companies in the market can be mediocre investments when the price tag is excessively high.
In simple terms, the sustainability of financial performance and the valuation levels are arguably the two main factors that investors may want to seriously assess when analyzing the companies in this screener.
Without further prologue, the table shows the 30 stocks currently included in the screen results. Data in the table also shows market capitalization value in millions, revenue growth rates in the past five years, and the average ROI over the past five years.
| Ticker | Name | Mkt cap | Sales5Yr% | ROI%5YAvg |
| AAPL | Apple Inc. | $1,375,503 | 7.31 | 26.2 |
| ATHM | Autohome Inc. | $9,148 | 28.6 | 25.19 |
| BIIB | Biogen Inc. | $50,434 | 8.18 | 23.86 |
| DOOO | BRP Inc. | $3,270 | 7.63 | 28.56 |
| CNS | Cohen & Steers Inc. | $3,211 | 5.53 | 40.25 |
| OTCPK:CNSWF | Constellation Software Inc. | $23,544 | 14.24 | 30.85 |
| CORT | Corcept Therapeutics Inc. | $1,736 | 63.1 | 34.51 |
| DPZ | Domino's Pizza Inc. | $14,600 | 12.66 | 82.93 |
| EA | Electronic Arts Inc. | $33,854 | 4.17 | 25.6 |
| FTDR | Frontdoor Inc. | $3,815 | 10.51 | 23.97 |
| HD | Home Depot Inc. | $266,407 | 5.79 | 34.71 |
| INVA | Innoviva Inc. | $1,479 | 98.67 | 38.59 |
| IHG | InterContinental Hotels Group PLC | $9,247 | 20.02 | 53.77 |
| LULU | Lululemon Athletica Inc. | $36,693 | 17.23 | 26.21 |
| MKTX | MarketAxess Holdings Inc. | $17,754 | 14.76 | 28.92 |
| MED | Medifast Inc. | $1,172 | 20.13 | 37.84 |
| MNST | Monster Beverage Corp. | $37,195 | 11.25 | 22.47 |
| NRC | National Research Corp. | $1,409 | 5.3 | 33.09 |
| NVO | Novo Nordisk A/S | $147,682 | 4.89 | 75.8 |
| NVDA | NVIDIA Corporation | $209,721 | 18.45 | 26.13 |
| PAYX | Paychex Inc. | $25,489 | 8.41 | 53.9 |
| PAYC | Paycom Software Inc. | $16,541 | 37.35 | 36.54 |
| PM | Philip Morris International Inc. | $115,086 | 0.03 | 42.12 |
| OTCQX:RHHBY | Roche Holding AG | $293,004 | 5.75 | 23.26 |
| ROK | Rockwell Automation Inc. | $25,393 | 0.21 | 20.68 |
| SPGI | S&P Global Inc. | $75,987 | 5.81 | 47.06 |
| SEDG | SolarEdge Technologies Inc. | $6,807 | 60.65 | 38.14 |
| TROW | T. Rowe Price Group Inc. | $27,919 | 7.13 | 27.85 |
| UI | Ubiquiti Inc. | $11,370 | 15.21 | 33.8 |
| WING | Wingstop Inc. | $3,546 | 24.24 | 28.07 |
Performance as of May 24, 2020

Disclosure: I am/we are long AAPL. I wrote this article myself, and it expresses my own opinions. I am not receiving compensation for it (other than from Seeking Alpha). I have no business relationship with any company whose stock is mentioned in this article.