Tata Motors Trading Near All-Time Low Ahead Of Earnings
by Rick PendergraftSummary
- Tata is set to report Q4 earnings results in the next few days and the company is expected to lose money once again.
- The company has been losing money for the last few years, but sales appear to have turned the corner in recent quarters.
- Tata's stock has fallen over 90% from its all-time high from five years ago.
- Sentiment toward the stock is bearish, but that sentiment is warranted based on how the company and the stock have done in recent years.
Tata Motors (TTM) debuted on the New York Stock Exchange back in 2004 and there was quite a bit of excitement surrounding the IPO back then. The excitement was twofold as it was an Indian company debuting on an American exchange and the company was a new automaker from Asia that wasn't based in Japan or Korea. The company made big news in 2008 when it acquired the Land Rover and Jaguar brands from Ford (NYSE:F). Unfortunately that acquisition came during the global financial crisis and it helped push Tata down to its all-time low.
Tata is set to report earnings in the next few days, but I wasn't able to find an exact date. According to the company's website, the results for the quarter ended on March 31, 2020 will be released on or before May 30.
After falling from its all-time high in 2015, the stock is now trading near that same low it hit in 2008. Investors would love to see some positive news out of Tata with the hope that it could help reverse the downward trend that has been going on for the better part of five years now.
Tata is much harder to analyze than the stocks I usually write about and I had to turn to different sources to get the fundamental picture on the company. According to the Wall Street Journal, the consensus estimate for the quarter is for EPS of -$0.15. This quarter also marks the end of the company's fiscal year and the consensus for the year is -$0.47.
Revenue for Tata has been increasing by an average of 1% per year over the last three years, but it was down by 8% in the third quarter compared to the previous year. Revenue has increased on a quarter over quarter basis in each of the last two quarters. Net income grew from 2015 through 2018, but it fell sharply in 2019.
Because the company has been losing money for the last few years, the return on equity is negative and it's pretty sizable negative at -37.05%. The profit margin is also negative, but not nearly as bad at -1.1%.
The Stock Fell Over 90% from 2015 High
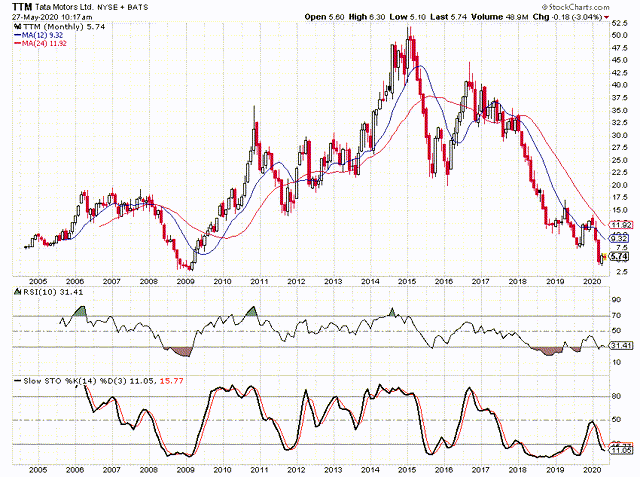
Tata peaked at $51.78 in February 2015 and it lost over 90% of its value between that high and the March low. The trend lower has been almost straight down with just a few strong rallies along the way. In 2016, the stock jumped from $20 to nearly $45, but then downward trend resumed and even seemed to accelerate. In 2018, the stock dropped in 11 of the 12 months.

The stock stabilized a little in 2019, but it was still pretty volatile. Since August 2016, Tata has seen its stock fall in 28 months and it has risen in only 16 months. Even in the four full months of 2020 the stock has dropped three of the four months.
Tata bottomed at $2.83 in March 2009 and it dropped as low as $3.92 in April. The stock has since rallied as high as $6.33 and it is currently up 47% from that low.
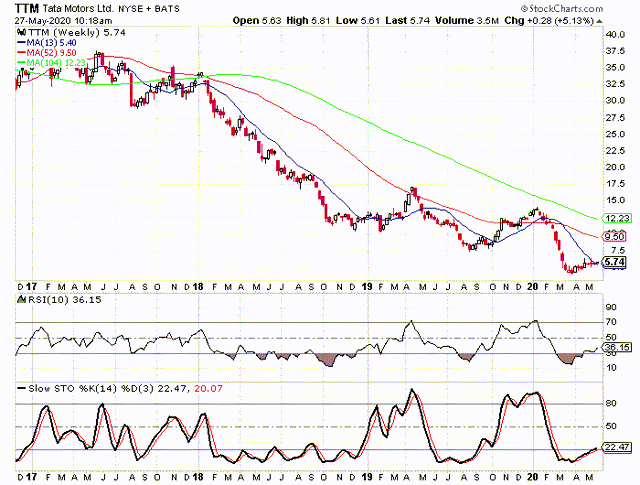
Turning to the weekly chart we see how the stock has been able rebound a little off of that low. The stock has been able to move back above its 13-week moving average and the 52-week and the 104-week are a long way off. At this point the stock would have to rally 65% to get to the 52-week and in order to get to the 104-week it would have to move up 113%.

Most stocks have moved well off their March lows and many are in or approaching overbought territory based on their weekly stochastic readings and the 10-week RSI. Tata is barely out of oversold territory in the case of both indicators. When the stock moved out of oversold territory last summer, it was able to rally from the $8 range up to $14, a 75% move. It could do the same thing here and it still wouldn't be up to the resistance of the 104-week.
The Sentiment is Bearish, but Warranted
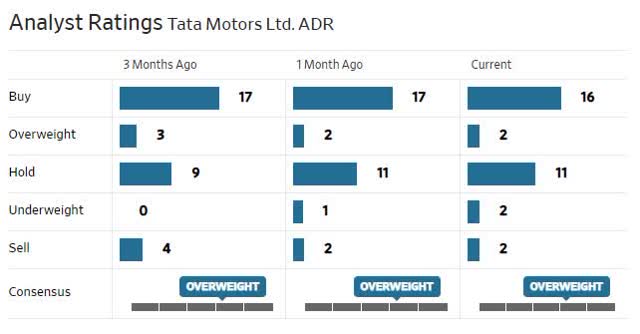
The sentiment toward Tata is slightly skewed to the bearish side, considering how the company has been losing money and given the huge drop in the stock price. There are 33 analysts covering the stock at this time. There are 18 "buy" ratings, 11 "hold" ratings, and four "sell" ratings. This gives us a buy percentage of 54.5% and that is slightly below average. Quite frankly, I expected it to be much lower than that.

The short interest ratio is currently at 5.0 and the number of shares sold short changed very little in the most recent reporting period. While the ratio is higher than the average stock, it is especially high for a stock that is trading under $10. Many times when a stock drops below $10 it gets put on the "hard to borrow" list and this creates lower short interest ratios for stocks below that threshold.
The put/call ratio is at 1.34 and I was a little surprised it was that high. This is above average and highly unusual for a low-priced stock. There are 17,523 puts open at this time and 13,109 calls open. Because the stock is trading between $5 and $6, there are a limited number of strikes below the current stock price while there are an infinite number of call strikes available. That's why it is so unusual to see such a high put/call ratio on a low-priced stock.
Overall, the sentiment is tilted to the bearish side. The analysts' ratings are probably more bullish than the stock deserves at this point, but the short interest ratio and the put/call ratio are much higher than average and way, way higher than most stocks trading below $10.
My Current Take on Tata Motors
At this point in time, buying Tata would be a tough call based on the fundamentals. The company has been losing money and earnings have been declining rather than growing. The ROE and profit margin are negative due to losing money. Sales seem to be trending higher, but that is about the only positive from the fundamental indicators.
On the technical side, the stock has dropped over 92% in just over five years and that is downright scary. The fact that the stock bottomed at a slightly higher price in March than it did in 2009 is a small positive factor. The stock is oversold based on the monthly stochastic indicators and the weekly stochastic readings look similar to what they did last summer when the stock rallied sharply.
The sentiment shows that analysts, short sellers, and option traders are all more bearish toward Tata than they are the average stock. The bearish sentiment is warranted based on how poorly the company has performed in recent years and how sharply the stock has declined in the last five years.
Taking all of this into account, buying Tata at this time would be a high risk trade, but it also has the potential to be a high reward trade. I don't think Tata will go out of business, but then again I didn't think GM would enter bankruptcy 12 years ago either. If you have the patience and the right risk profile, buying Tata under $10 could prove to be a great buy, but I think it will be a very long-term trade.
I am considering buying the stock in my IRA at this point and if I do, I will take an approach that I have used on a couple of other low-priced stocks. If the stock doubles in the next year or so, I would sell half of the position and then leave the second half open. This reduces my risk to zero for the overall trade, but I still have tremendous upside potential on the second half. I have used this strategy with Fannie Mae when I bought it for $1.30 in 2018 and I did it more recently with B2 Gold when I bought it for $2.60 in 2019.
I wouldn't suggest making a big allocation to Tata, but rather making a small allocation with the realization that it could end up being a loss of 50% or more. At the same time, it could also produce a 400% or 500% gain over the next five years or so. Personally, I make these trades in my IRA so that I don't have to pay capital gains taxes on the big gains, but that is my personal preference. I'm not a tax expert and everyone's tax situation is different.
If you would like to learn more about protecting and growing your portfolio in all market environments, please consider joining The Hedged Alpha Strategy.
One new intermediate to long-term stock or ETF recommendation per week
One or two option recommendations per month
Bullish and bearish recommendations to help you weather different market conditions
A weekly update with my views on the market, events to keep an eye on, and updates on active recommendations
Disclosure: I am/we are long FNMA, BTG. I wrote this article myself, and it expresses my own opinions. I am not receiving compensation for it (other than from Seeking Alpha). I have no business relationship with any company whose stock is mentioned in this article.
Additional disclosure: I may initiate a long position in Tata within the next 72 hours.