The L In L-Shaped Recovery Stands For Long
by Lawrence FullerSummary
- This is a weekly series focused on analyzing the previous week’s economic data releases.
- The objective is to concentrate on leading indicators of economic activity to determine whether the economy is strengthening or weakening, and the rate of inflation is increasing or decreasing.
- This week we examine consumer confidence, new home sales, durable goods orders, personal income and spending, followed by weekly unemployment claims.
- We may have hit an inflection point, but the recovery is going to be a very long one.
Consumer Confidence
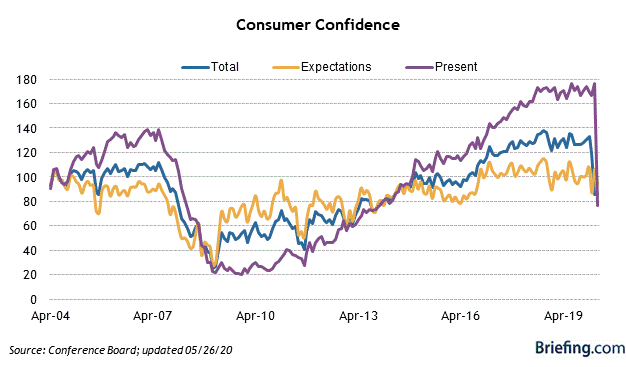
The Conference Board’s Consumer Confidence Index edged slightly higher to 86.6 for May, which is up from 85.7 in April. The employment category showed the most improvement, which is consistent with what we saw in the jobs report, but that gives me pause. Most of those who are unemployed think they are going to be rehired when the economy fully reopens. I think many of them will be disappointed. Additionally, many will also be underemployed or earning lower wages. Confidence levels have yet to bottom.
New Home Sales
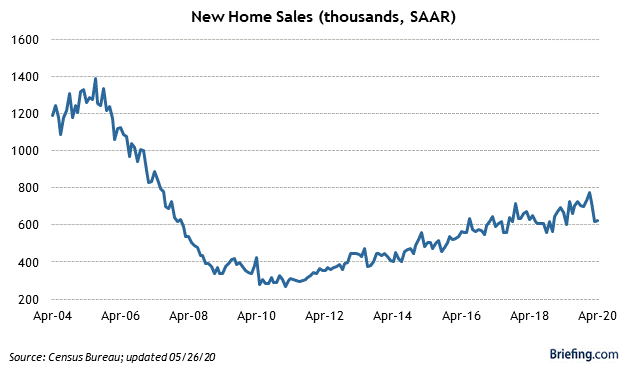
New home sales continue to be a bright spot for the economy, despite declining 6.2% year-over-year in April, due to the shutdown. Sales actually rose to an annualized 623,000 in April from 619,000 in March. New lows in mortgage rates and limited supply should continue to support new and existing home purchases. New home prices are down 8.6% from a year ago, which is another factor supporting demand.
Durable Goods Orders
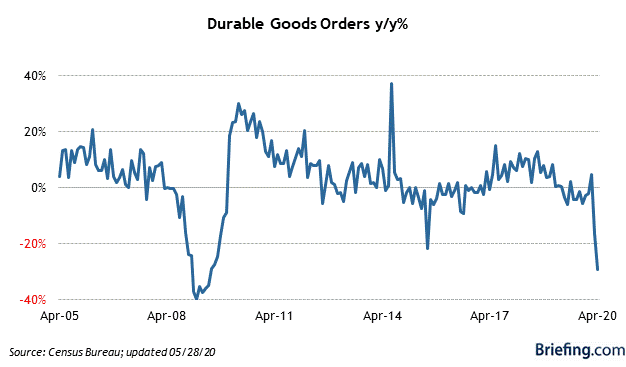
Orders fell 17.2% in April, while excluding transportation the number was a decline of 7.4%. The March decline of 14.4% was revised down to 16.6%. Orders for auto vehicles and parts plunged 52.8%! Orders for nondefense capital goods excluding aircraft, otherwise known as capital spending, declined 5.8%, while shipments fell 5.4%. One bright spot in the report was the computer and electronics category, which held up well, only declining 0.3%. This may have had a lot to do with people working from home and purchasing the tech equipment needed to do so.
Personal Income and Spending
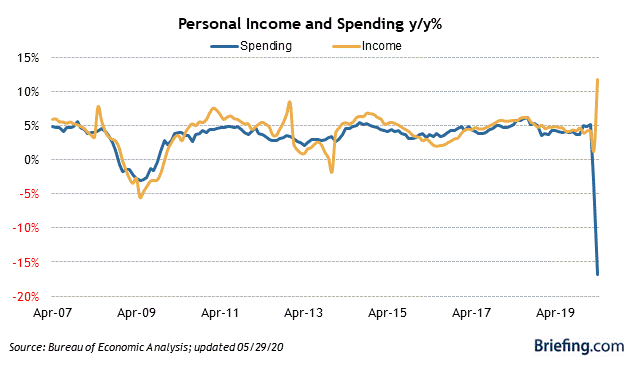
Income soared 10.5% in April, but don’t get too excited. This was a result of the cash Congress sent to consumers. Wages and salaries ended up declining 8%, due to the more than 20 million who lost their jobs. Spending plunged 13.6%. The personal saving rate surged 33%. The big question is where did all that money go? I suspect that some was spent online, while more was used to pay monthly bills. I seriously doubt enough was saved to strengthen consumer balance sheets. Spending at hospitals and for outpatient services was down 32%, which had the greatest impact on the decline in service sector spending.
The Personal Consumption Expenditure price index (PCE), which is the Fed’s preferred measurement of inflation, fell 0.5%. The core rate, which excludes food and energy, was down 0.4%. The year-over-year rate is up 0.5%, while the core is up 1.0%. There is no inflation to be concerned with for now.
Unemployment Claims
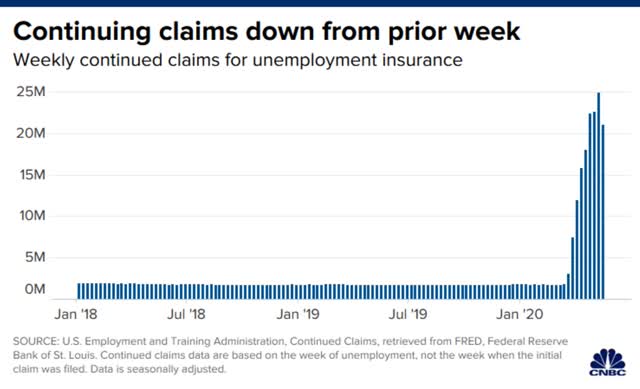
Initial claims rose another 2.1 million, bringing the total to more than 40 million. Yet we hopefully hit the inflection point for continuing claims, which for the first time fell some 4 million to 21 million, indicating people are going back to work. That comes as no surprise, as many states have reopened their economies. The good news is it means the peak in unemployment is behind us, but the bad news is that 21 million are still receiving enhanced unemployment claims and most will lose them in two months. Additionally, we have millions more that are underemployed or not counted in this figure. The insured unemployment rate dropped from 17.1% to 14.5%, but I suspect when we include those not insured the rate jumps closer to 20%.
Conclusion
It appears we have passed the inflection point that marks the deepest point of economic contraction. While the economic data will continue to show declines on a quarterly and annual basis, we will begin to see month over month improvement. That doesn’t mean that the recovery will be shaped like a V or a U, which is what the stock market seems to be anticipating. I believe it will be shaped like an L, which suggests a recovery so long that you can’t see the upturn on the horizon.
While millions of workers will return to work, millions more will not. While job creation is critically important, it is income that is the life’s blood of a consumer-based economy, and income growth is the heart that pumps that blood to make the economy grow. Not only will we have fewer jobs, but we will also have less income and there will be no growth in it for some time. Therefore, it will take several years, at best, for the economy to recover to its prior size or form. Income fuels consumption, and consumption fuels economic growth. Corporate revenue and profits are derived from economic growth. It is as simple as that.
Lots of services offer investment ideas, but few offer a comprehensive top-down investment strategy that helps you tactically shift your asset allocation between offense and defense. That is how The Portfolio Architect compliments other services that focus on the bottom-ups security analysis of REITs, CEFs, ETFs, dividend-paying stocks and other securities.
The Portfolio Architect was defensively positioned at the beginning of this year in anticipation of the bear market that followed, but were you? If not, consider a two-week free trial to see how it may help you be better positioned for the next major turning point in the markets.
Disclosure: I/we have no positions in any stocks mentioned, and no plans to initiate any positions within the next 72 hours. I wrote this article myself, and it expresses my own opinions. I am not receiving compensation for it (other than from Seeking Alpha). I have no business relationship with any company whose stock is mentioned in this article.
Additional disclosure: Lawrence Fuller is the Managing Director of Fuller Asset Management, a Registered Investment Adviser. This post is for informational purposes only. There are risks involved with investing including loss of principal. Lawrence Fuller makes no explicit or implicit guarantee with respect to performance or the outcome of any investment or projections made by him or Fuller Asset Management. There is no guarantee that the goals of the strategies discussed by will be met. Information or opinions expressed may change without notice, and should not be considered recommendations to buy or sell any particular security.