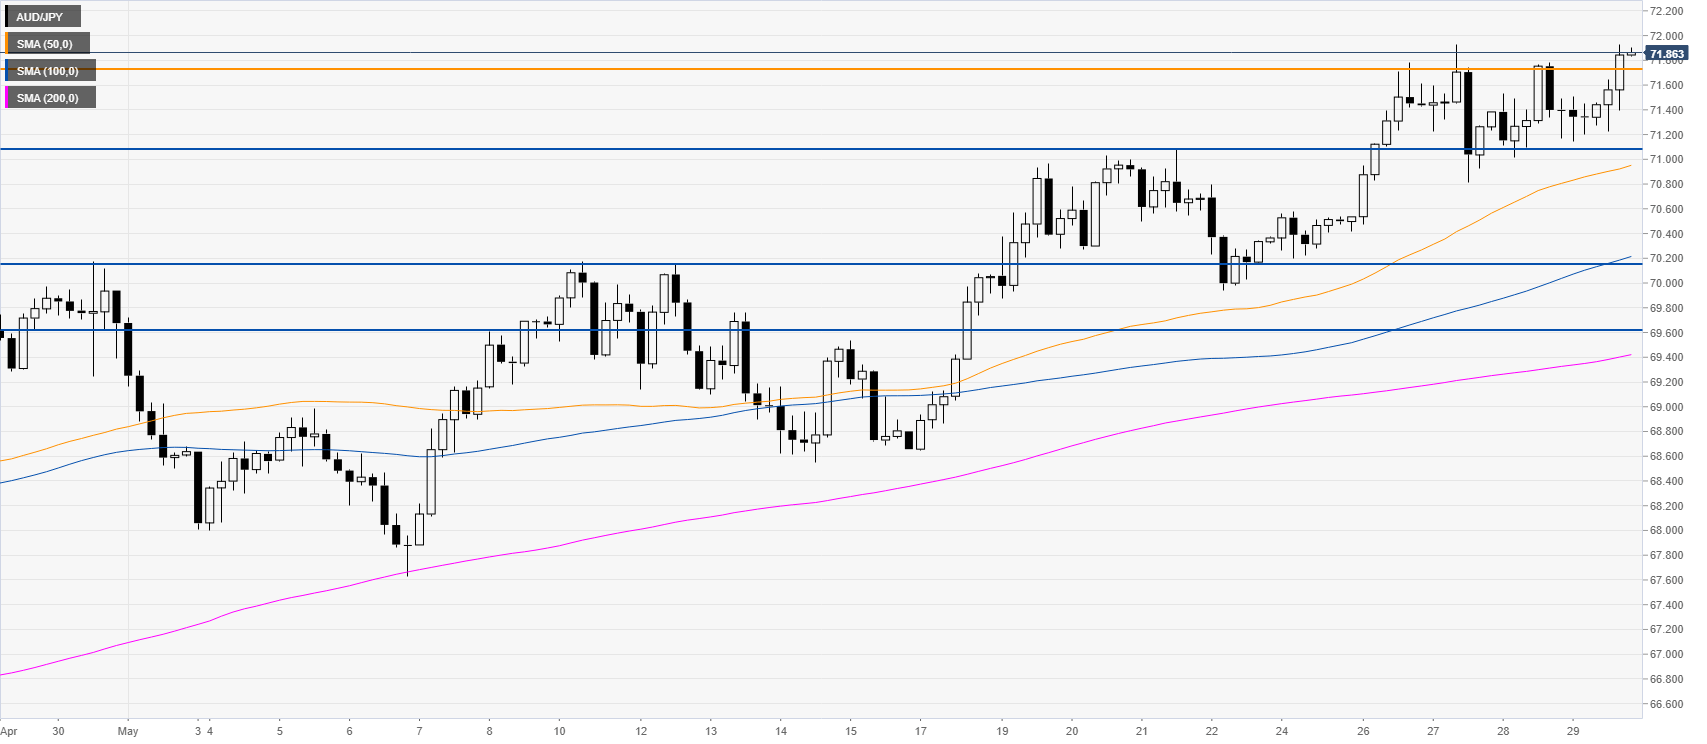
AUD/JPY Price Analysis: Aussie finally breaks above the 71.75 resistance
by Flavio Tosti- AUD/JPY is trading in 12-week highs as the risk-on sentiment in Wall Street remains buoyant.
- AUD/JPY ends the month of May by finally breaking above the 71.75 resistance.
AUD/JPY four-hour chart
AUD/JPY is printing higher highs and lows as the positive sentiment in Wall Street remains intact. The quote finally broke above the 71.75 level as the month of May comes to an end. Looking up, the next resistance can be seen near the 72.50/88 price zone. On the other hand, a turn lower below the 71.10 level could be seen as bearish in the medium-term with supports lined up near 70.15 and 69.60 levels.

Additional key levels
AUD/JPY
| Overview | |
|---|---|
| Today last price | 71.88 |
| Today Daily Change | 0.44 |
| Today Daily Change % | 0.62 |
| Today daily open | 71.44 |
| Trends | |
|---|---|
| Daily SMA20 | 69.79 |
| Daily SMA50 | 68.39 |
| Daily SMA100 | 70.28 |
| Daily SMA200 | 72.14 |
| Levels | |
|---|---|
| Previous Daily High | 71.78 |
| Previous Daily Low | 71.02 |
| Previous Weekly High | 71.08 |
| Previous Weekly Low | 68.65 |
| Previous Monthly High | 70.17 |
| Previous Monthly Low | 64.4 |
| Daily Fibonacci 38.2% | 71.49 |
| Daily Fibonacci 61.8% | 71.31 |
| Daily Pivot Point S1 | 71.05 |
| Daily Pivot Point S2 | 70.65 |
| Daily Pivot Point S3 | 70.28 |
| Daily Pivot Point R1 | 71.81 |
| Daily Pivot Point R2 | 72.18 |
| Daily Pivot Point R3 | 72.57 |