Gold: Making Its Seasonal Top
by Equity Management AcademySummary
- We are trading gold now as a currency against the US dollar.
- The current crisis has burst the bubble of the Keynesian idea of supplying stimulus to the market to generate economic activity when needed.
- The relationship between the stock market and the main street economy appears to have been disconnected.
- The Federal Reserve is pumping record stimulus into the economy.
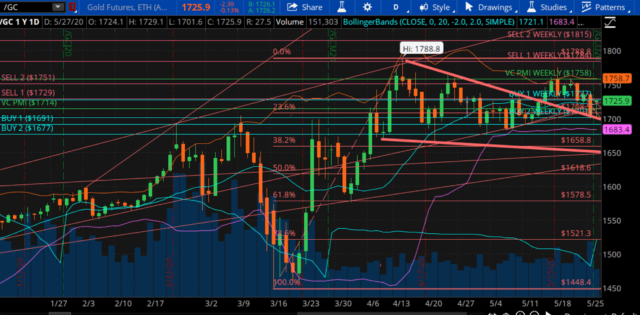
- Gold has come down from a high of $1788 into a deflationary spiral.
Gold
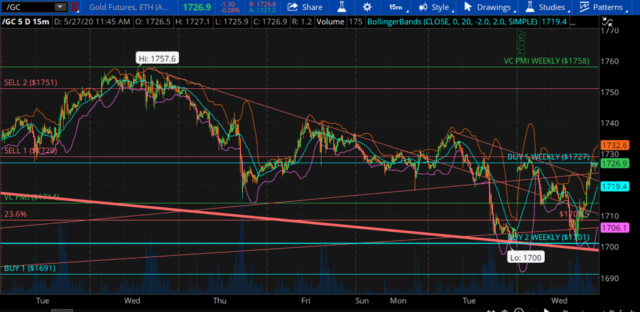
May 27, 2020 at 7 am PST. The June contract is going off the board. The low was $1700 on the June contract. The August contract started at $1725, which was a huge gap. There was an arbitrage opportunity to short the August against the June. You would sell the August and exercise the June contract.
The price rose to the Variable Changing Price Momentum Indicator (VC PMI) Buy 1 level. The market then came down and filled in the gap. It made a low of $1701.6. The market then reverted from that level, which is also the Buy 2 level of the weekly signal.
We have had a couple of losses on the futures trades. If we take more than two losses, the VC PMI tells us to stand aside. We are not on margin, but we are excited about the buying opportunity at these levels. The price is coming down into a major level of support. We are using the VC PMI to identify where the end of the correction will occur.
We have seen a massive $300 rally from March 20 to April 14. That was a complete reversal of the massive liquidation in precious metals. Gold transitioned from a commodity into a currency.

Courtesy: TDAmeritrade
Fundamentals
We are trading gold now as a currency against the US dollar. From a fundamental point of view, gold is the opposite of the US dollar. Since Nixon lifted the gold standard in 1971, gold exploded from $35 to $800 in 1971. It then began to transform into a currency. The dollar began to trade on the basis of crude oil. The US dollar has deteriorated about 98% in buying power since 1971. The current crisis has burst the bubble of the Keynesian idea of supplying stimulus to the market to generate economic activity when needed. If we look back to 2008, we have seen little to no economic growth, other than the stock market trading at record highs. The relationship between the stock market and the main street economy appears to have been disconnected. Only those with the resources to buy stocks get the growth and they are subsidized by the government through stimulus payments. According to Chairman Powell, the Federal Reserve is able and willing to do whatever it takes to contain this crisis. We have never seen this before.

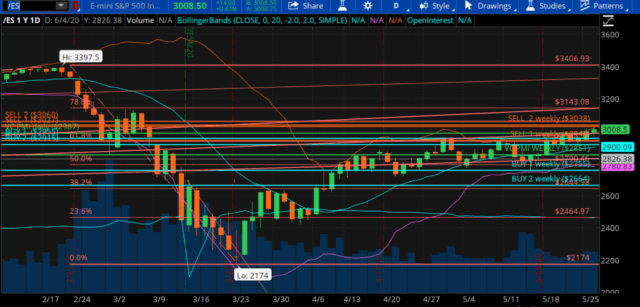
The magnitude of the correction that we saw, exceeded the 1929 crash in terms of the time frame. From February 20 to March 23, the market collapsed from 3397. Then we started to essentially trade virtually. The money came into the market and bought the lows when the stock market exchange was closed due to COVID-19. The stock market has been trading electronically for a long time, but the old economic system integrated itself virtually as a result of the economic collapse triggered by COVID-19. The old system has collapsed. The numbers that we are getting are staggering in terms of GDP. We are going to get potentially 30% or 40% decline in GDP. The unemployment numbers are also staggering. Yet the stock market continues to make new highs. The pattern is turning bullish technically; we have a head and shoulders bottom. It is very similar to the gold pattern. Around March 20, after making a low of $1450.90, gold reverted back within three days and got back all it had lost and went to a high of $1788.80. It was a $300 move within 30 days.
The only reason the US dollar is still showing strength is because it is a safe haven asset. Whenever there is a crisis, money flies to the US dollar.
The Federal Reserve is pumping record stimulus into the economy. The trillions of dollars that initially went into the financial markets to avoid a collapse. They have stabilized the markets. The stock market is near record highs, above 3,000. But the issue now is with Main Street. The unemployment and corporate casualties have not yet been fully accounted for. The first phase of adjustment does not seem to have been enough. The printing presses are going at full speed because we are going to see massive additional amounts of stimulus into the market, unlike anything we have seen. And it will be global, not just the United States. The US can print as much money as it wants, but Third World countries that use the US dollar as a reserve currency and whose debt is in US dollars, are facing a major problem. They can't print more US dollars. There is no limit to the amount of money the US is going to print, but will that be enough to bring Main Street back into play? Right now, the economy is at a dead stop.
All of this points to inflation. We have not yet seen that inflation in prices. We are seeing an implosion in values. Supply and demand, and production are all broken. Every industry has to readjust to this new economic system or economic reality. They are all trying to get as much of the stimulus as they can to survive. Inevitably, that means that the purchasing power of the US dollar will decline. Even though leaders do not appear to be concerned about the inflationary effect, the gold market will anticipate that happening.
The VC PMI Structure For Gold
Gold has come down from a high of $1788 into a deflationary spiral. It has come right down into a level that is a major buying area of support around the weekly signal of $1701. If we do hold here, and come back up above $1714, we will activate a bullish price momentum with short-term targets up to $1751. The first weekly target is $1727 and the second is $1758, which is the weekly mean.

We are holding long positions in gold. These levels that the VC PMI is identifying are strong levels of support. Trading above $1714 is a bullish signal with the daily target of $1729. The weekly target is 1558. When the daily and weekly signals are in harmony, it is a very strong indication that the market is going to move in that direction.
To learn more about how the VC PMI works and receive weekly reports on the E-mini, gold and silver, check out our Marketplace service, Mean Reversion Trading.
Disclosure: I/we have no positions in any stocks mentioned, and no plans to initiate any positions within the next 72 hours. I wrote this article myself, and it expresses my own opinions. I am not receiving compensation for it (other than from Seeking Alpha). I have no business relationship with any company whose stock is mentioned in this article.