US Dollar Index Index Price Analysis: DXY ends the week near 10-week lows
by Flavio Tosti- US Dollar Index (DXY) is trading at levels last seen in mid-March.
- DXY is testing a key support level at the 98.00 figure.
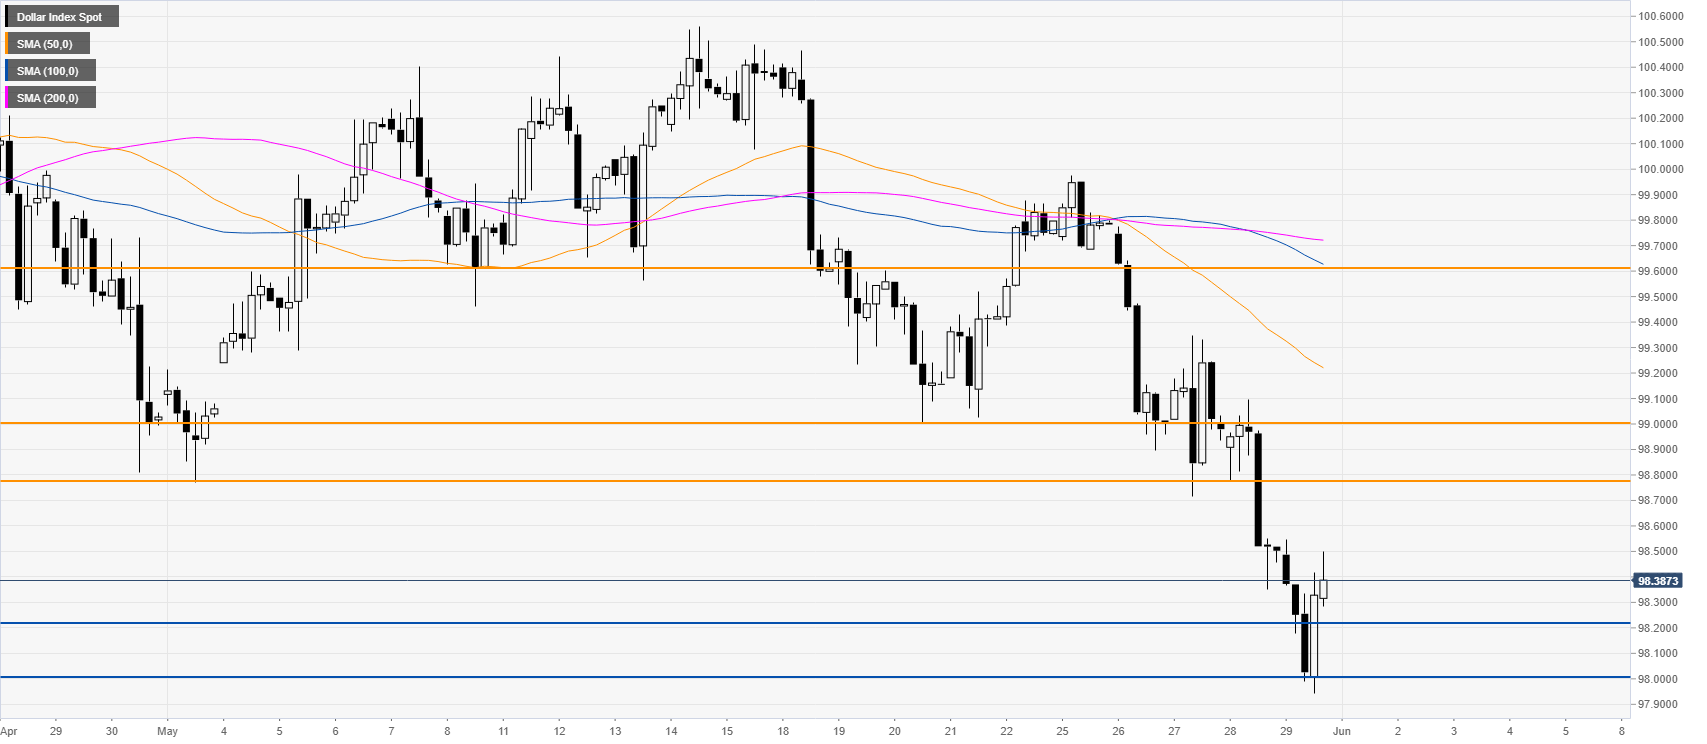
DXY four-hour chart
DXY dropped to the 98.20/98.00 support zone while under below the main SMAs. If the market can find some footing here, the index might rebound. However, a break below 98.00 can send the index towards the 97.50 and 97.00 levels in the medium term while resistance could be seen near the 98.80 and 99.00 levels initially.

Additional key levels
Dollar Index Spot
| Overview | |
|---|---|
| Today last price | 98.43 |
| Today Daily Change | -0.05 |
| Today Daily Change % | -0.05 |
| Today daily open | 98.48 |
| Trends | |
|---|---|
| Daily SMA20 | 99.65 |
| Daily SMA50 | 99.88 |
| Daily SMA100 | 99.03 |
| Daily SMA200 | 98.51 |
| Levels | |
|---|---|
| Previous Daily High | 99.1 |
| Previous Daily Low | 98.35 |
| Previous Weekly High | 100.47 |
| Previous Weekly Low | 99 |
| Previous Monthly High | 100.93 |
| Previous Monthly Low | 98.81 |
| Daily Fibonacci 38.2% | 98.64 |
| Daily Fibonacci 61.8% | 98.81 |
| Daily Pivot Point S1 | 98.19 |
| Daily Pivot Point S2 | 97.9 |
| Daily Pivot Point S3 | 97.44 |
| Daily Pivot Point R1 | 98.93 |
| Daily Pivot Point R2 | 99.38 |
| Daily Pivot Point R3 | 99.67 |