The Big Money In Leveraged 3x ETFs
by Josef FriedmanSummary
- Rewards of prudently trading leveraged ETFs outweigh risks.
- Specter/FF5 market timing strategies radically improve returns on 3x ETFs.
- These products, and derivatives in general, seem to destabilize the financial system.
The Legend
My previous article on Specter/FoxForce5 showed 5 Finite State sub strategies easily beating buy and hold for 20 major ETFs since 2013, considering only the characteristics of SPY's 13 day exponential and simple moving averages for trading decisions.
The development effort has been based on analyzing natural log returns, as those are the best in human/computer joint financial algorithm construction.
A major, almost universal error, in financial algorithm design is to try to force the computer into dealing with human concepts. For example, one such concept that I have discussed here previously is the trade; there is no convincing reason for a strategy algorithm to deal with that.
Natural log returns can be transformed back to more human friendly terms with the Excel Exp function:
The VBA Exp function returns the value of the exponential function ex at a supplied value of x. I.e. the function returns the mathematical constant e (the base of the natural logarithm) raised to a supplied power. Where the supplied Number is the power that you want to raise the constant e to.
The number that Exp returns must exactly equal the present value of each dollar invested at the start price.
The common human technique for calculating present value is the formula (Current Price / Start Price). For example, if a stock is bought at 10 and increases to 20, each dollar originally invested is now worth 2. The original investment (1) is typically subtracted from the result to express the number as a percentage; that is, 2 - 1 = 1 = 100%.
I haven't looked at Exp transformations closely as part of my project, because up to this point, work was focused on algorithm development and hence the natural log return.
Leveraged ETFs
From Dissecting Leveraged ETF Returns
The first leveraged ETFs were introduced in the summer of 2006, after being reviewed for almost three years by the Securities And Exchange Commission (SEC).
There is a lot of academic interest in these products. Tristan Yates, the author of the quoted article is considerably freaked out about transaction costs:
The Bottom Line Leveraged ETFs, like most ETFs, are simple to use but hide considerable complexity. Behind the scenes, fund management is constantly buying and selling derivatives to maintain a target index exposure. This results in interest and transaction expenses and significant fluctuations in index exposure due to daily rebalancing. Because of these factors, it is impossible for any of these funds to provide twice the return of the index for long periods of time. The best way to develop realistic performance expectations for these products is to study the ETF's past daily returns as compared to those of the underlying index.
Mr. Yates is referring 2x leveraged bull ETFs. In this article, we will discuss returns on 3x leveraged bull ETFs.
This article will show that these products can be extremely profitable without all that much increased risk. It will also show that my definition of "impossible" is a little more stringent than Mr. Yates.
Buy and Hold Returns
Created by the author with data from Norgate
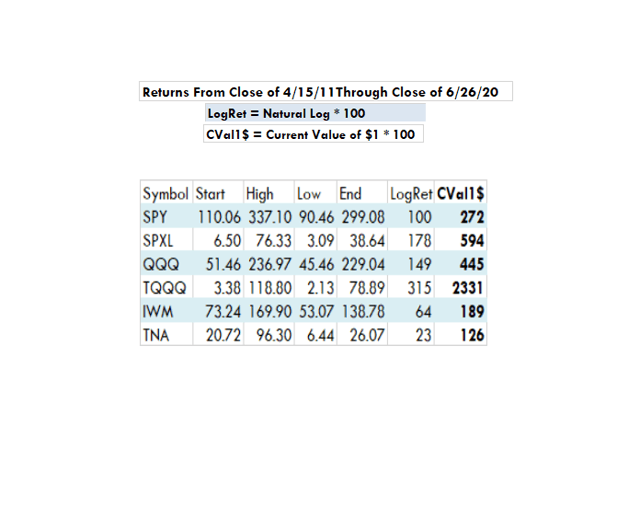
A quick glance at the LogRet column shows that none of the 3x ETFs achieved three times the natural log return of the underlying index over the 9 year period. Note, TNA actually underperformed IWM.
It is easier for a human to understand the situation with the CVal1$ column. QQQ and TQQQ are the elephants in the room as TQQQ has returned over $23 for every $1 investment. That is over 5x the performance of QQQ over the same period which only made $4.45 for each dollar. However, judging by the arithmetic distance between natural log returns (149 vs. 315) TQQQ barely seems to have returned twice as much.
Precise returns, even for long-term time periods, are obviously highly dependent on the current market state; looking at these now show very different numbers than we would have seen at the end of 2019 or just after that little pricing kerfuffle in February/March.
An investor would have done much better holding equal amounts of all three of the 3x leveraged ETFs for the last 9 years than holding equal amounts of all three of the non-leveraged ones.
That can be shown by either adding up the natural log or the CVal1$ returns for the two portfolios. Looking at the numbers works pretty well.
Specter/FF5 Returns
My two recent articles about FoxForce5 review this finite state trading strategy in some depth. The first article discusses technical details of the logic engine, while the second demonstrates spectacular results (at least by my standards) over seven plus years.
The strategy is either long or flat based on a Specter/FF5 signal that is produced at the close of each day. A Specter/FF5 signal is only received from a single security, so all the members of the portfolio are either long or flat on exactly the same days.
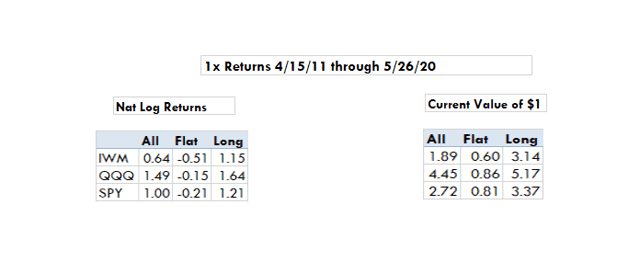
It is easiest to split the ETFs into 2 groups. A summary of the results of the non-leveraged group is shown below.
Created by the author with data from Norgate
If the natural log return is negative as we see with the Flat situations, the current value of $1 invested will be less than a dollar. For example, if an investor buys IWM in a flat situation and reinvests returns in subsequent trades, he will wind up with $0.60 for each dollar he initially invested.
It is cool that all three of the ETFs lose money when Specter/FF5 is flat. That is a positive sign for the soundness of the strategy, the length of the test period also matters.
Because log returns in the flat states are negative, the long states must be better than buy and hold. The All columns show Buy and Hold results. The results can be quantified by comparing the totals of the All Current Value column with the Long Current Value column.
Created by the author with data from Norgate
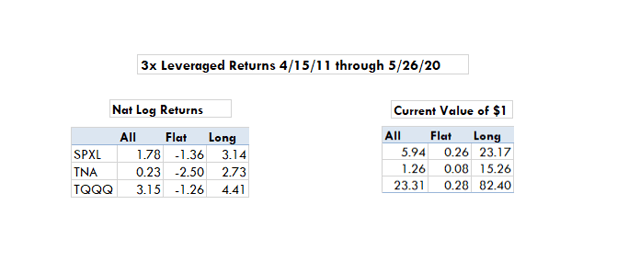
If a human looks at the natural log returns, at first glance, they don't look all that special. Notice the elevated negatives in the flat numbers. The strategy trades all easily beat buy and hold with about 50% time in the market.
The current value numbers, I had real difficulty grasping. The TQQQ current Value Long number is 82.40. That is saying if you put $12,500 into this strategy in 2011, it would have grown to over a million today.
The other numbers are somewhat less incredible. The TNA long strategy made 3 times the buy and hold return of QQQ.
Back Testing
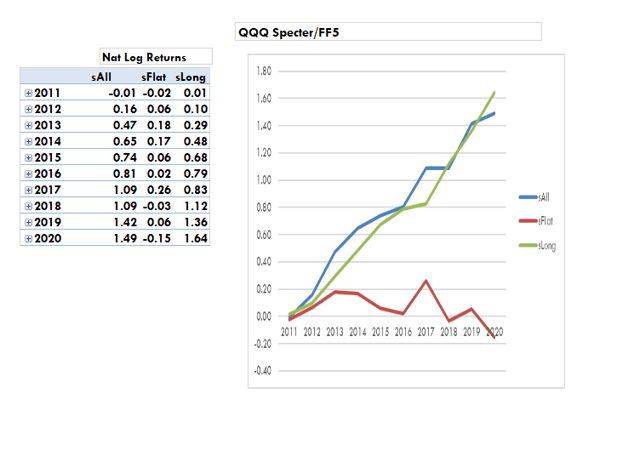
There is a lot written about this subject. It is pretty much checking past results, but after that the conversations start getting weird. The image below shows my historical analysis for QQQ.
Created by the author with data from Norgate
The table shows running totals for return by year. On the graph, the blue line is buy and hold, the green line is the long strategy and the red line is flat.
The strategy does better if the underlying stock wiggles a bit. QQQ has been so strong that it is not easy to beat buy and hold. The strategy has been quite strong for the last 5 years or so.
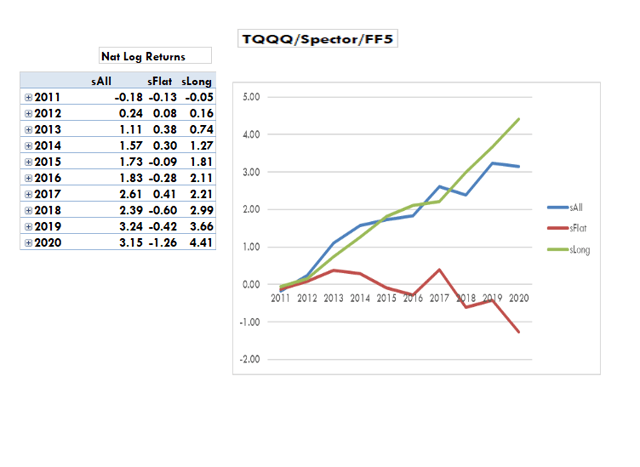
TQQQ is shown below.
Created by the author with data from Norgate
This looks similar to the QQQ study except the TQQQ numbers are magnitudes larger. QQQ turned $1 into $5.17, TQQQ turned it into $82.40.
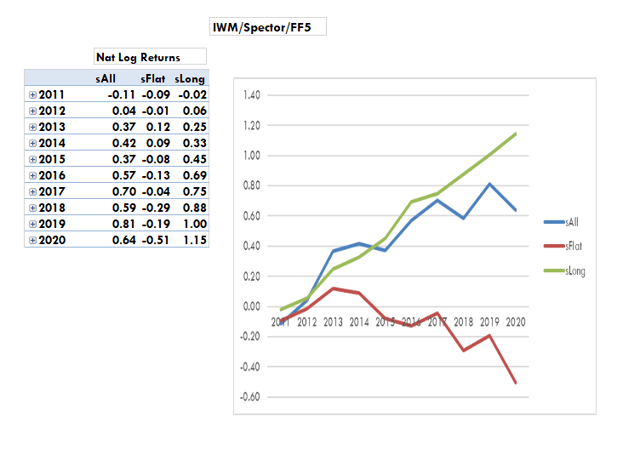
IWM vs. TNA shows how well the strategy plays dubious issues.
Created by the author with data from Norgate
The natural log of .64 for sAll indicates a current value for $1 of $1.89. The long strategy triples its money by comparison to $3.14.
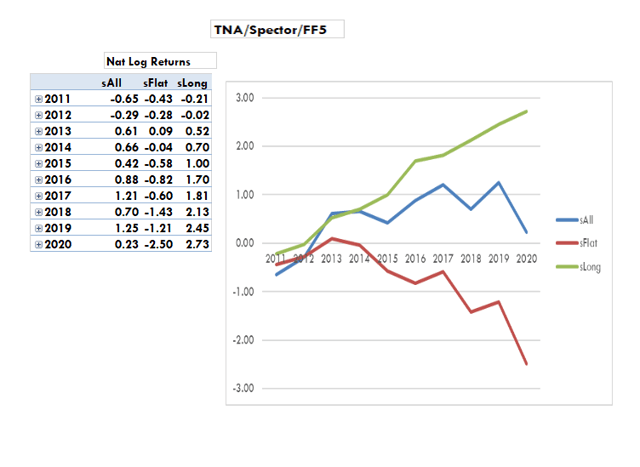
TNA looks a little better and performs a lot better.
Created by the author with data from Norgate
The long return of 2.73 makes the current value of $1, $15.26. This is over 7 times the return for IWM.
Final Remarks
The stuff presented here is the result of trying to demonstrate my research in a clearer way than I have in the past. I don't look at leveraged ETFs much and was amazed at the results.
Generally, my goal is to demonstrate that data analysis is the most effective discipline for analyzing equity price movement. This might be a good example of that.
A lot of the intelligent activity in SPXL is done by convexity and gamma traders, presumably relatively sharp guys because that gets a little too theoretical for me. The SEC took three years to decide to let these things exist and my guess is that the technical aspects weren't well understood then or now. Always something to worry about I guess.
I don't get short leveraged ETFs. They are almost never technically favorable to buy. Selling them short is not easy because you have to find someone deranged enough to hold them long term to borrow them from.
3x leveraged ETFs get nothing but bad press, but their little quirks and peculiarities make them quite attractive if you know what you are doing.
Disclosure: I am/we are long QQQ. I wrote this article myself, and it expresses my own opinions. I am not receiving compensation for it. I have no business relationship with any company whose stock is mentioned in this article.