AUD/JPY Price Analysis: Aussie pressuring monthly highs vs. yen, bullish
by Flavio Tosti- AUD/JPY is trading close to 12-week highs as the risk-on sentiment in Wall Street remains intact.
- The level to beat for bulls is the 71.75 resistance.
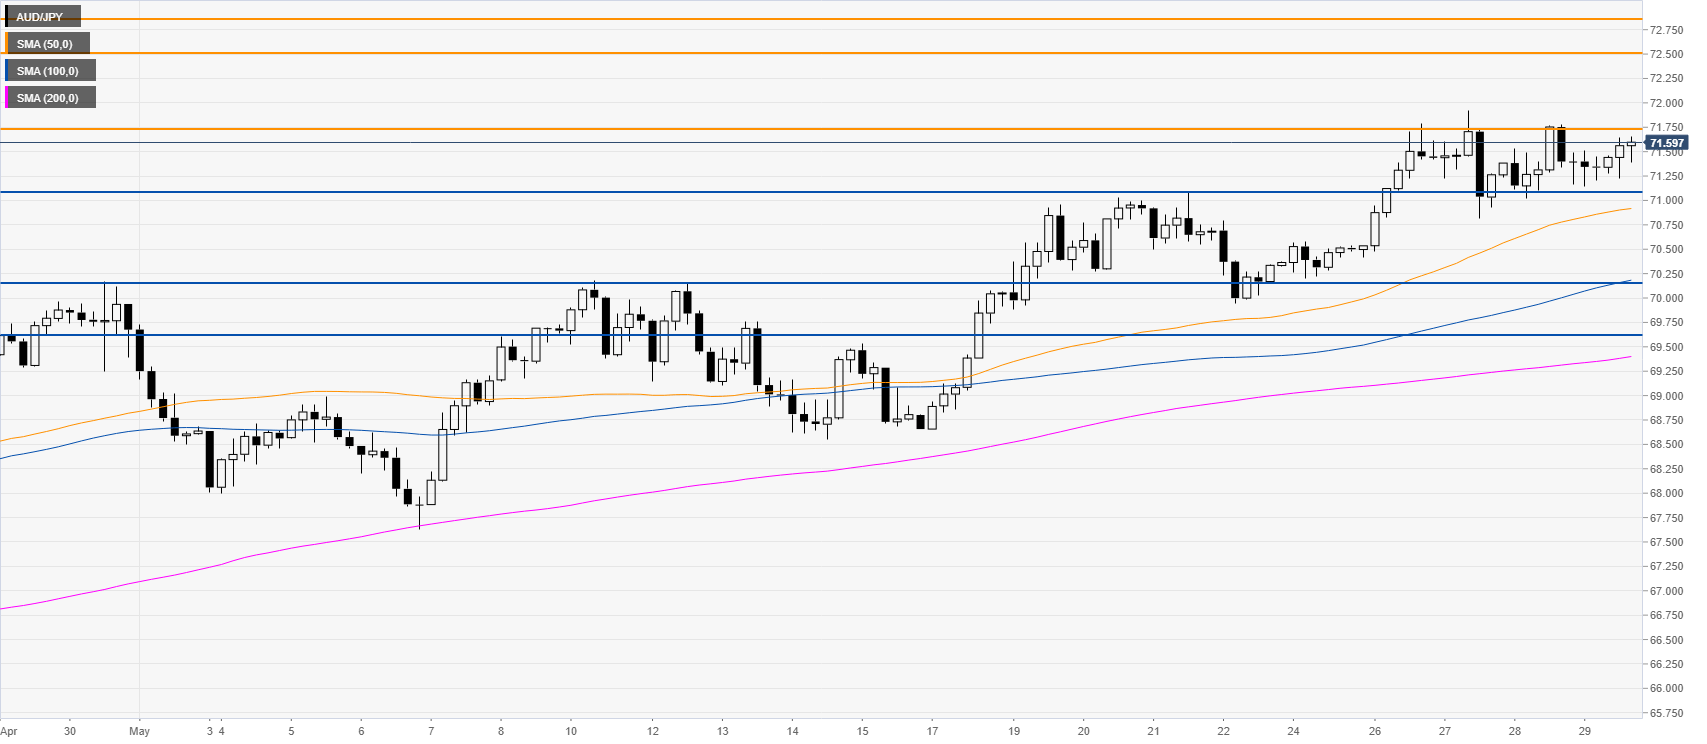
AUD/JPY four-hour chart
AUD/JPY is making higher highs and lows as the bullish sentiment stays intact. The quote is about to challenge the 71.75 level as the risk-on mood in Wall Street remains present. To the upside, the next resistance can emerge near the 72.50/88 price zone. On the flip side, a convincing break below the 71.10 level could lead to further selling in the medium-term with supports awaiting near 70.15 and 69.60 levels.

Additional key levels
AUD/JPY
| Overview | |
|---|---|
| Today last price | 71.58 |
| Today Daily Change | 0.14 |
| Today Daily Change % | 0.20 |
| Today daily open | 71.44 |
| Trends | |
|---|---|
| Daily SMA20 | 69.79 |
| Daily SMA50 | 68.39 |
| Daily SMA100 | 70.28 |
| Daily SMA200 | 72.14 |
| Levels | |
|---|---|
| Previous Daily High | 71.78 |
| Previous Daily Low | 71.02 |
| Previous Weekly High | 71.08 |
| Previous Weekly Low | 68.65 |
| Previous Monthly High | 70.17 |
| Previous Monthly Low | 64.4 |
| Daily Fibonacci 38.2% | 71.49 |
| Daily Fibonacci 61.8% | 71.31 |
| Daily Pivot Point S1 | 71.05 |
| Daily Pivot Point S2 | 70.65 |
| Daily Pivot Point S3 | 70.28 |
| Daily Pivot Point R1 | 71.81 |
| Daily Pivot Point R2 | 72.18 |
| Daily Pivot Point R3 | 72.57 |