Gold Mining Stocks Flip From Losses To 5x Leveraged Gains
by Jason HamlinSummary
- This 2020 gold price target of $3,000 is a little too aggressive in my view, but I would not be surprised if gold reaches this level at some point over the next few years.
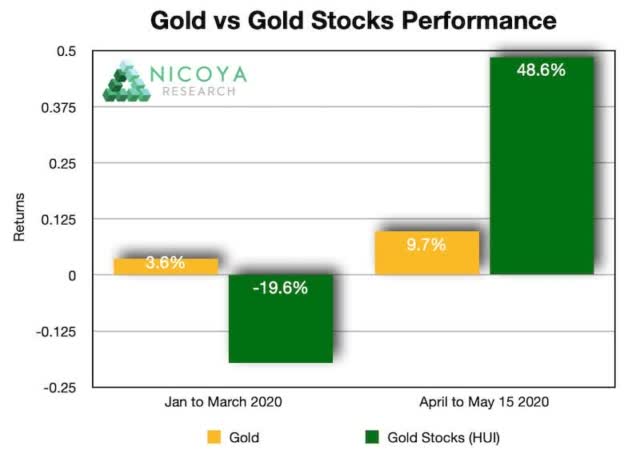
- During the first 3 months of the year, the gold price climbed a modest 3.6%, while the HUI actually declined by around 20%.
- if we are correct in our gold price forecast for $2,000 or more this year and $3,000 by the end of next year, the upside for both gold and gold mining stocks is just getting started.
The gold price made a new 2020 high today and looks poised to take out the nominal all-time high around $1,920 and then challenge $2,000 in the months ahead. Some are even estimating that gold could climb to $3,000 by year-end on account of the nearly $10 trillion in new money/debt/stimulus that is being created in the US alone to fight the pandemic.
This 2020 gold price target of $3,000 is a little too aggressive in my view, but I would not be surprised if gold reaches this level at some point over the next few years. Indeed, there seems to be no limit to the amount of new money the Fed is willing to create and the government is willing to hand out in order to keep things afloat.
While I always advocate for holding some physical gold in your possession as an insurance policy, it is the gold mining stocks that can generate leveraged returns for investors. This isn't always the case, but I believe we have just entered one of the bull cycles that will see sustained leveraged gains from quality gold mining stocks.
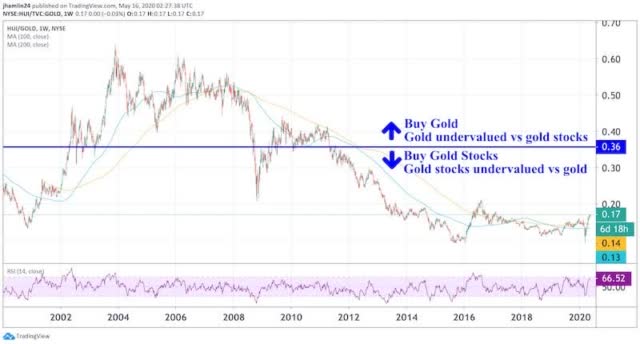
First, let's see if gold mining stocks are currently undervalued or overvalued relative to the metal that they mine. The chart below shows the NYSE Arca Gold BUGS Index (HUI) divided by the gold price. The NYSE Arca Gold BUGS Index is a modified equal dollar weighted index of companies involved in gold mining. BUGS stands for Basket of Unhedged Gold Stocks.
The HUI/Gold ratio provides a simple way to assess the relationship between mining stocks and gold over time.

The blue line shows the average of this ratio over the past 20 years. In general, gold is undervalued vs. gold stocks when the ratio is above the blue line, and gold stocks are undervalued vs. gold when the ratio is below the blue line.
The current ratio of 0.17 suggests that gold mining stocks are very undervalued relative to gold. This ratio has averaged roughly 0.36 since the year 2000, so the current reading is less than half of the historic average over the past 20 years. Gold stocks would need to continue offering leveraged gains for a while before this ratio climbs back toward the long-term average of 0.36.
It is worth noting that the ratio has nearly doubled from a low of 0.09 in March to the current level. This is because we have seen gold mining stocks significantly outperform gold over the past month or two. And we believe this trend is just getting started.
We knew from studying the past two major stock market corrections in 2001 and 2008/09 that the inverse relationship would not last. Likewise, the severe underperformance of mining stocks does not make sense for the simple reason that their profit margins rise at a much faster pace than the gold price.
For a quick example, at $1,200 gold, a gold miner with costs of $1,000 has a $200 (20%) profit margin. But as the gold price advances by 50% from $1,200 per ounce to $1,800 per ounce, the miner's profit margin increases from $200 to $800. That is a 4x (300%) gain from a 50% move higher in the gold price, assuming costs stay relatively flat.
In the current scenario, costs may actually be decreasing, as the labor pool grows from people losing their jobs during the pandemic and energy/oil prices slide to all-time lows.
Charting the Performance of Gold vs Gold Stocks
During the first 3 months of the year, the gold price climbed a modest 3.6%, while the HUI actually declined by around 20%. Not only were mining stocks failing to offer leveraged gains, but there was actually an inverse relationship as investors sold off all equities, including gold stocks, in a panicked rush to liquidity.

Over the past 6 weeks from April 1st to May 15th, the gold price is up roughly 10%, while the HUI is up 49%! Mining stocks have come roaring back to offer leverage of roughly 5x in the past month and a half.
Anticipating this reversion to leveraged gains for gold miners, we added two new junior mining stocks to the Gold Stock Bull portfolio in February and two more in March. Those positions have enjoyed double-digit gains in a very short time period.
Can these levels of incredible leveraged returns in mining stocks continue?
For the answer, we turn to the HUI/gold ratio chart in the beginning of this post. It showed that while the ratio nearly double from the March lows to 0.17, it was still significantly below the longer-term average of 0.36. So, we believe mining stocks can continue with leveraged gains for quite some time.
And if we are correct in our gold price forecast for $2,000 or more this year and $3,000 by the end of next year, the upside for both gold and gold mining stocks is just getting started.
The more money the Federal Reserve creates out of thin air and deeper in debt the United States goes, the higher the upside potential for the gold price. With Fed Chair Powell committing to unlimited stimulus and the potential for negative interest rates, the appeal of gold as a scarce asset that can offer safe-haven only grows.
Editor's Note: The summary bullets for this article were chosen by Seeking Alpha editors.