Bears Trade By Day, Bulls By Night
by Lawrence FullerSummary
- Stock market returns for the month of May have been an overnight phenomenon.
- Fed liquidity is the only thing fueling this fundamental-less rally.
- Consensus earnings estimates for 2021 are more about perception than reality.
- There is historical precedent for the bear to growl again over the next six months.
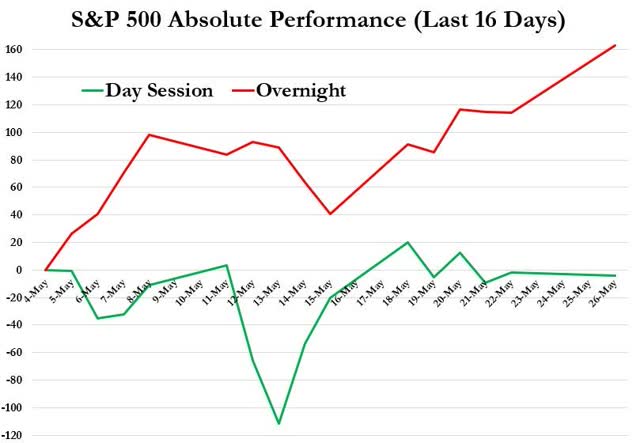
It feels like the S&P 500 has been on a steady march upward every day through the month of May, fueled by expectations for a V-shaped recovery in the economy and a vaccine to eradicate the coronavirus. The reality is that this march only takes place in the wee hours of the early morning. That’s when the indices surge in the futures market, lifting the opening price of the index and its constituents from the prior close without the cash purchase of a single share. The bears wake up midday, selling off most of the rally by the close. There is nothing unusual about seeing a sharp move in either direction in the futures market before the exchanges open for trading, but what is unusual is to see such a consistent divergence between the two where all of the gains in the index occur overnight, followed by a decline during the trading day from open to close.

Source: ZeroHedge
I’m not proposing a conspiracy theory of any kind, although that would be a convenient way to explain this phenomenon, but what it does suggest is that this rally is on thin ice. Strong opens and weak closes are like the sniffles before you get the flu. It is not a sign of strength. Additionally, the volume over the past couple of weeks in the S&P 500 (SPY) has been pitiful, barely reaching 100 million shares.

Source: YahooFinance
Compare this level of optimism with the level of pessimism we saw two months ago, during which we had three times the volume, and there is no contest.

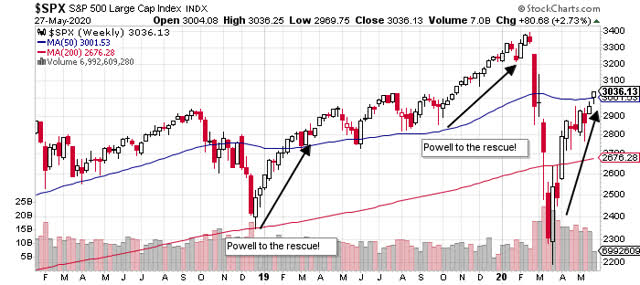
Still, regardless of how thin the ice is beneath the bulls’ feet, the S&P 500 has rebounded sharply over the past two months, and it is starting to look like the V-shaped recovery that bulls are expecting in the economy. The problem is that this is a fundamental-less rally, fueled largely by Fed liquidity, which is simply stealing forward market returns in a twisted game of “perception versus reality,” leaving the economic fundamentals far behind. All the Fed accomplishes by inflating financial assets is the creation of more market instability down the road, when investors realize that they have been duped into thinking that the stock market was discounting an improving economic landscape.

If the Fed wants to support the economy, as it says it does, then it should take the $22,500 per taxpayer that it has digitally printed over the past few months ($3.2 trillion) and put more than $1,200 of it in the hands of each consumer. Otherwise, it should stop pretending its policies are anything other than a trickle-down, market-manipulating Ponzi scheme. The perception the Fed is trying to create is not reality.
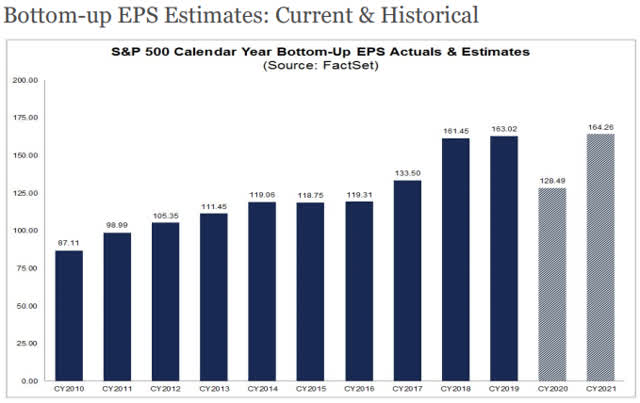
Wall Street continues to play the same game of perception versus reality by dangling a carrot in front of investors to persuade them to stay invested in the stock market. The carrot they are dangling today is an estimate for S&P 500 earnings in 2021 that exceeds the profits earned in 2019. As John McEnroe would say, “you can’t be serious.” Yet this is the only way to justify the index at 3,000 or higher. All it requires you to do is close your eyes and jump over 2020 like it was a pothole in the road. The reality is that it is a canyon a mile wide.

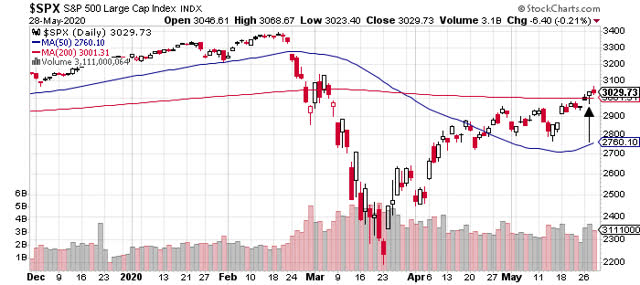
The bulls celebrated climbing above the 200-day moving average this week, as though it were a rite of passage to a new bull market. Hold your horses! I came across a statistic last week that suggests just the opposite. The S&P 500 index traded between its 50-day and 200-day moving averages for 22 consecutive trading days before the recent breakout. That was only the 30th time since 1928 that the index traded between these two averages for more than 20 days. The S&P 500 broke below the 50-day average after 21 of those periods. This was the ninth time it broke above. Yet in all previous eight times it broke above, it ended up lower six months later by an average of 12.7%.

For the day traders that are having a field day in this market, a statistic like this is meaningless. For investors buying into the narrative that we have started a new bull market, it is daunting. I continue to view the past two months as nothing more than a bear-market rally, typical of what we have seen during previous bear markets, and I am preparing for another decline over the summer months ahead.
Lots of services offer investment ideas, but few offer a comprehensive top-down investment strategy that helps you tactically shift your asset allocation between offense and defense. That is how The Portfolio Architect compliments other services that focus on the bottom-ups security analysis of REITs, CEFs, ETFs, dividend-paying stocks and other securities.
The Portfolio Architect was defensively positioned at the beginning of this year in anticipation of the bear market that followed, but were you? If not, consider a two-week free trial to see how it may help you be better positioned for the next major turning point in the markets.
Disclosure: I/we have no positions in any stocks mentioned, and no plans to initiate any positions within the next 72 hours. I wrote this article myself, and it expresses my own opinions. I am not receiving compensation for it (other than from Seeking Alpha). I have no business relationship with any company whose stock is mentioned in this article.
Additional disclosure: The Portfolio Architect is published as an information service. Lawrence Fuller, the publisher, is also the Managing Director of Fuller Asset Management, a Registered Investment Advisor, which is unaffiliated with this Marketplace service. While this service includes opinions about buying, selling and holding a wide range of securities, the publisher is not acting as an investment adviser or providing advice or recommendations to any particular subscriber. Any investment recommended should be made only after consulting with your investment advisor or completing your own due diligence. There are risks involved with investing including loss of principal. Mr. Fuller makes no explicit or implicit guarantee with respect to performance or the outcome of any investment or projections made. There is no guarantee that the goals or the strategies discussed by will be met.