S&P 500 Price Analysis: US stocks advance taking a breather above 3000 mark
by Flavio Tosti- The bullish recovery is taking a breather above the 3000 mark.
- Support can emerge near the 3000 and 2960 levels.
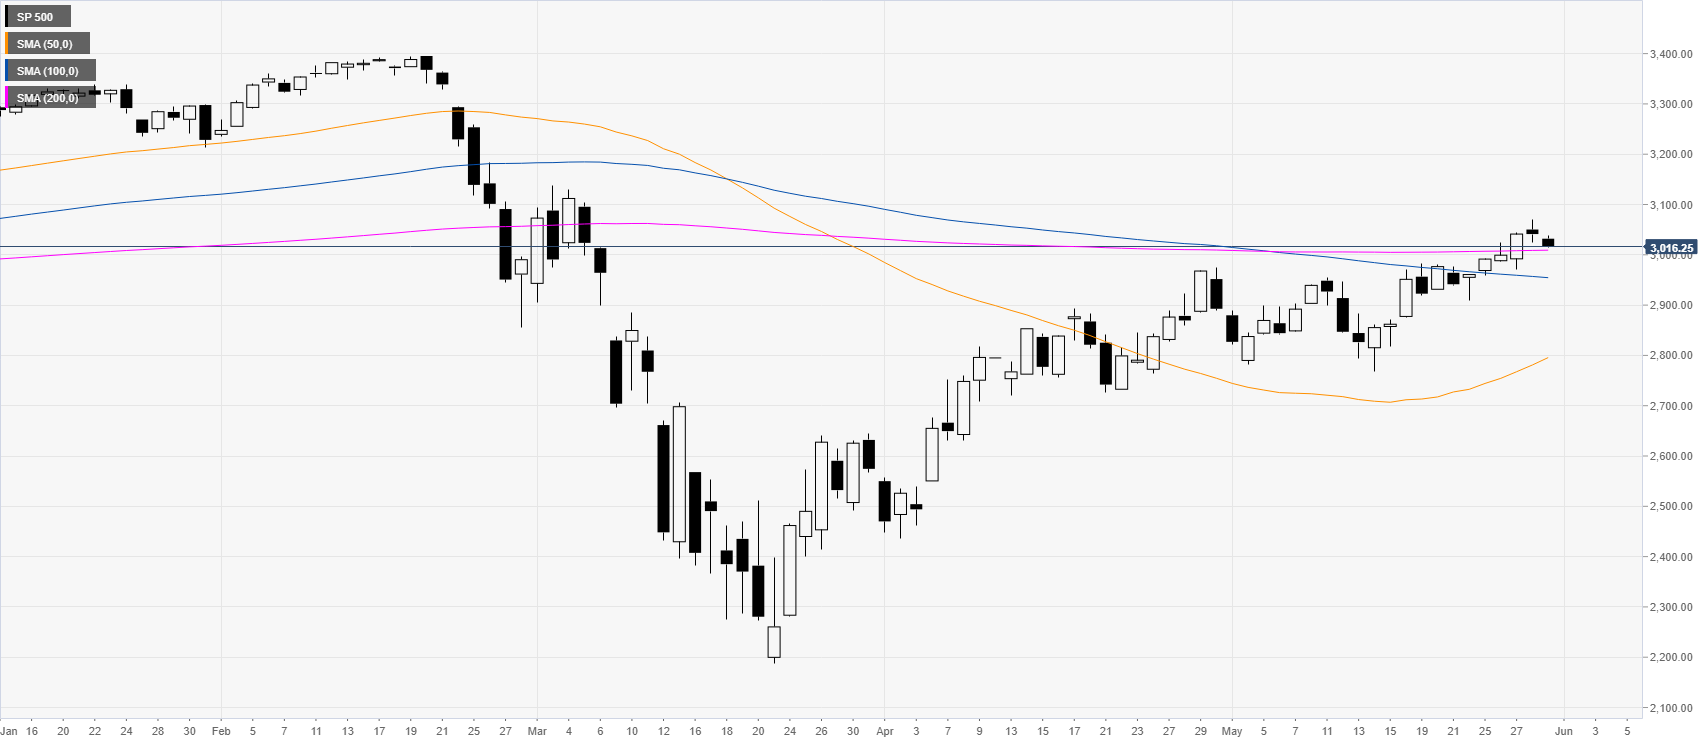
S&P 500 daily chart
After the crash seen in February-March, the S&P 500 is rebounding up sharply while regaining most of the lost ground. The market is hovering in 2.5-month highs above its main SMA on the daily chart. The index broke beyond the 3000 key resistance which is seen as a bullish sign. As buyers stay firmly in control, the index is eyeing the 3075/3100 price area and the 3180 level in the medium-term. On the flip side, support can emerge the 3000, 2960 and 2900 levels initially.

Additional key levels
SP 500
| Overview | |
|---|---|
| Today last price | 3019.25 |
| Today Daily Change | -22.00 |
| Today Daily Change % | -0.72 |
| Today daily open | 3041.25 |
| Trends | |
|---|---|
| Daily SMA20 | 2917.66 |
| Daily SMA50 | 2780.98 |
| Daily SMA100 | 2956.99 |
| Daily SMA200 | 3008.73 |
| Levels | |
|---|---|
| Previous Daily High | 3069.5 |
| Previous Daily Low | 3023.75 |
| Previous Weekly High | 2982.5 |
| Previous Weekly Low | 2874.5 |
| Previous Monthly High | 2974 |
| Previous Monthly Low | 2436.25 |
| Daily Fibonacci 38.2% | 3041.23 |
| Daily Fibonacci 61.8% | 3052.02 |
| Daily Pivot Point S1 | 3020.17 |
| Daily Pivot Point S2 | 2999.08 |
| Daily Pivot Point S3 | 2974.42 |
| Daily Pivot Point R1 | 3065.92 |
| Daily Pivot Point R2 | 3090.58 |
| Daily Pivot Point R3 | 3111.67 |