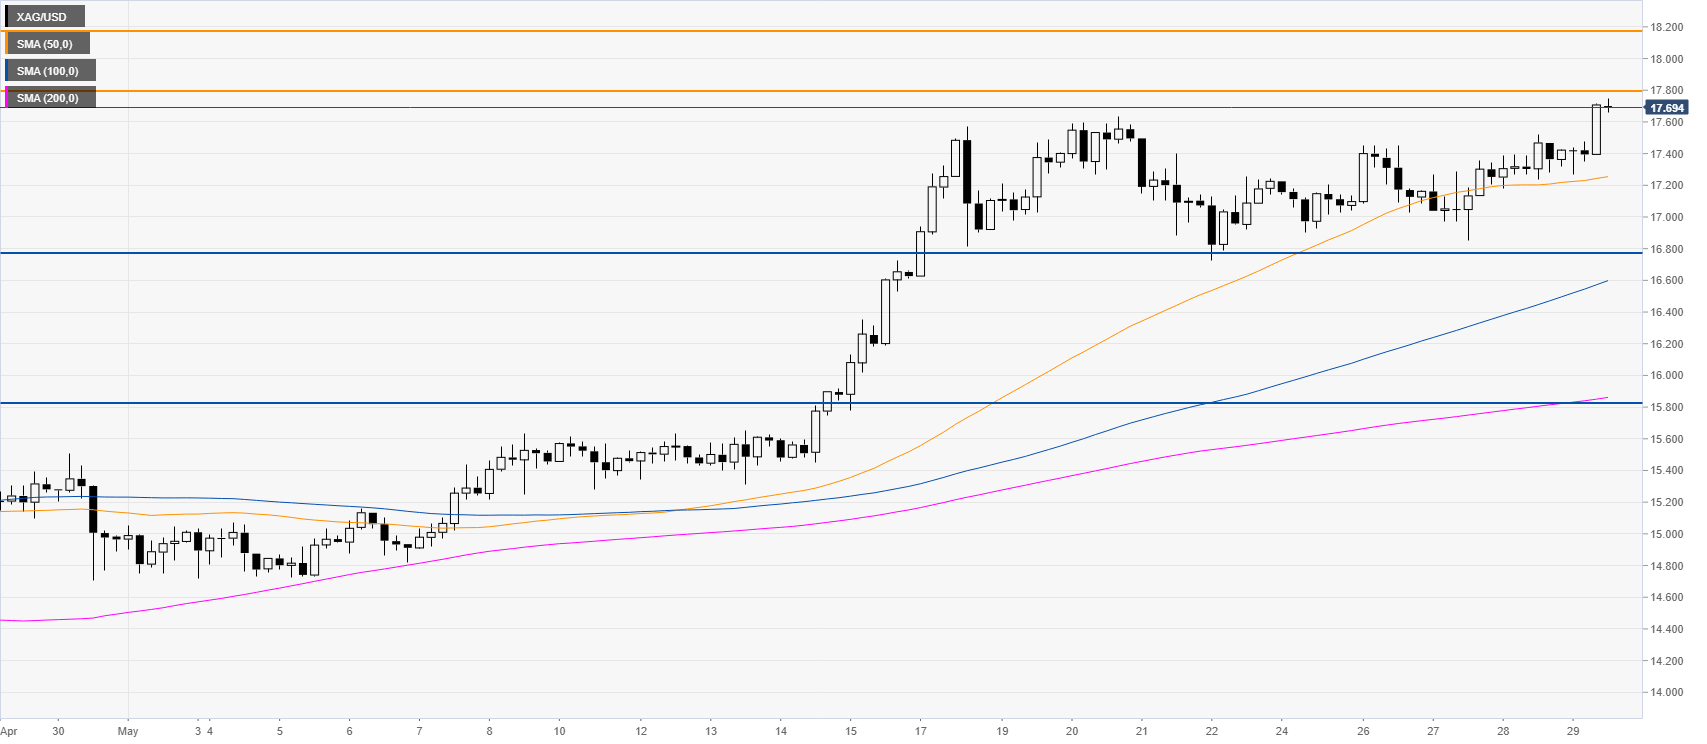
Silver New York Price Forecast: XAG/USD rises to 3-month highs
by Flavio Tosti- XAG/USD is trading at levels last seen in late February.
- The level to beat for bulls is the 17.80 resistance.
Silver four-hour chart
Silver is trading in 3-month highs just under the $17.80 per troy ounce resistance. The white metal is gaining some steam while above its main SMAs on the four-hour chart. However, buyers would need a convincing break above the 17.80 level to extend the bullish run towards the 18.20 and 18.80 levels. On the other hand, a break below the 16.80 support can lead to a deep pullback down towards the 15.84 level.

Resistance:17.80, 18.20, 18.80
Support: 17.45, 16.80, 15.84
Additional key levels
XAG/USD
| Overview | |
|---|---|
| Today last price | 17.7 |
| Today Daily Change | 0.35 |
| Today Daily Change % | 2.02 |
| Today daily open | 17.35 |
| Trends | |
|---|---|
| Daily SMA20 | 16.22 |
| Daily SMA50 | 15.3 |
| Daily SMA100 | 16.31 |
| Daily SMA200 | 16.95 |
| Levels | |
|---|---|
| Previous Daily High | 17.52 |
| Previous Daily Low | 17.18 |
| Previous Weekly High | 17.63 |
| Previous Weekly Low | 16.63 |
| Previous Monthly High | 15.85 |
| Previous Monthly Low | 13.82 |
| Daily Fibonacci 38.2% | 17.39 |
| Daily Fibonacci 61.8% | 17.31 |
| Daily Pivot Point S1 | 17.18 |
| Daily Pivot Point S2 | 17.01 |
| Daily Pivot Point S3 | 16.84 |
| Daily Pivot Point R1 | 17.52 |
| Daily Pivot Point R2 | 17.7 |
| Daily Pivot Point R3 | 17.87 |