The Gold/Silver Ratio Begins To Trend Lower
by Andrew HechtSummary
- The Gold/Silver ratio reached a new record high in March when silver tanked.
- The ratio has now dropped below the 100 level as silver continues to recover.
- Silver often leads during significant rallies.
- We can draw parallels with 2008.
- If silver is going to lead, buy USLV on dips.
The modern-day average for the silver-gold ratio at the beginning of 2020 on the quarterly chart was the 55:1 or 55 ounces of silver value in each ounce of gold value. The low came in 1979 at just below 15.5:1 and the high in 1990 at just under 94.6:1.
Meanwhile, the relationship between the two precious metals dates back five thousand years to the first Egyptian Pharaoh Menes. In around 3000 BC, he declared that two and one-half parts silver equal one-part gold when the metals were the primary means of exchange and symbols of wealth.
In 2020, the ratio blew past the previous high like a hot knife goes through butter. Since the new peak, the ratio turned lower, which could validate that gold and silver prices are heading higher over the coming months and years. If silver is taking over as the leader of the two metals, the Velocity Shares 3X Long Silver ETN product (USLV) could be a useful tool on price corrections over the coming weeks and months. USLV provides a leveraged return compared to the iShares Silver Trust (SLV), the most liquid silver ETF product. On May 9, I wrote an article for Seeking Alpha outlining the similarities between 2008 and 2020. On that day, July silver was below $16 per ounce. The silver-gold ratio was close to the 110:1 level.
A new record high in March when silver tanked
At the end of 2019, it took approximately 85 ounces of silver to purchase an ounce of gold on the continuous futures contracts on COMEX. The nearby gold futures contract settled at $1520 at the end of December 2019, with silver futures at $17.90 per ounce.
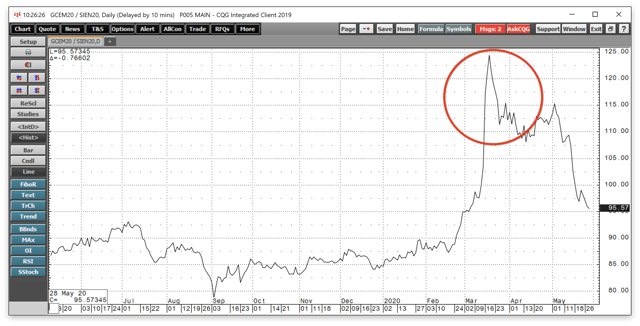
The previous all-time high in the ratio on the quarterly chart came in 1990 at 94.58:1. Last year, it got up to a peak of 92.5:1, but retreated by the end of the year. When risk-off selling hit the silver market in March and took the price to its lowest level since 2009, gold declined, but its losses were modest compared to silver. Silver fell below $12 per ounce, and the ratio soared.
Source: CQG
The chart shows that in mid-March, it took 124.4 ounces of silver to purchase a single ounce of gold, a new modern-day record high. Gold never declined below its breakout level from June 2019 at $1377.50. The yellow metal only reached a low of $1450.90 in March, but silver’s descent to $11.74 sent the ratio flying on the upside.
The ratio drops below the 100 level as silver continues to recover
Since March, and my May 9 piece, the price of silver has come storming back in the upside.
Source: CQG
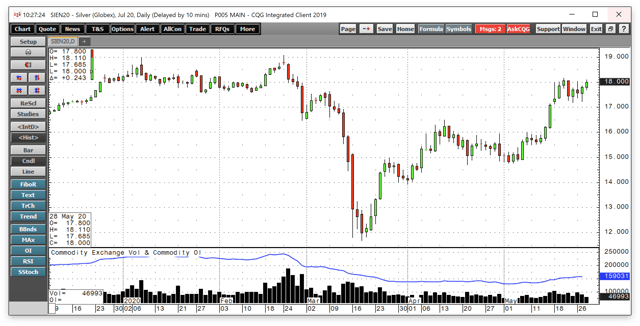
The daily chart of the active month July COMEX silver futures illustrates the decline from $19.075 on February 24 to $11.68 on March 18 or 38.8%. Since then, silver recovered to settle at $17.693 on May 22, 51.5% higher than the mid-March low. Silver traded to its most recent high of $18.165 on May 20. Since May 9, the price moved over 15% higher.
The decline in silver caused many market participants holding speculative long positions to flee the market in February and March. The total number of open long and short positions in the COMEX futures market declined from a record high 244,705 contracts on February 24 to 159,031 on May 27, a drop of 35%, At the low, the open interest metric reached 131,830 contracts. Silver recovered most of its losses; many market participants remain on the sidelines after the brutality of the price action in February and March. On May 9, open interest stood at 137,969 contracts. The rise of over 21,000 contacts as the price moved over $2 higher tends to be a technical validation of the current bullish trend in the silver futures market.
Source: CQG
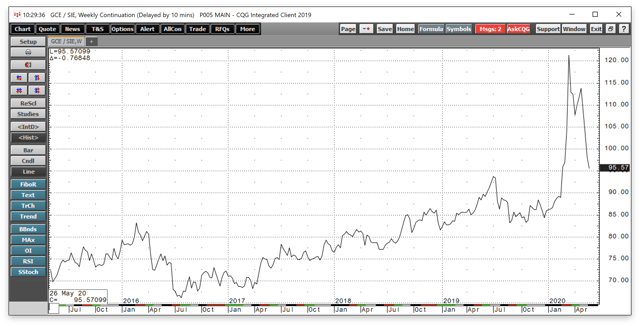
Meanwhile, the weekly chart of nearby COMEX gold futures divided by July silver futures shows that the ratio dropped steadily to below the 96:1 level as of May 28.
Silver often leads during significant rallies
I often refer to silver as a “trading sardine.” The metal tends to attract speculative interest that determines the price behavior. The risk-off environment in March is the perfect example. As market participants moved to the sidelines, it created a mass exodus from the silver market. In a testament to silver’s underlying strength, the selling dried up, and the price moved higher even though many market participants that had held long positions have not returned to the futures market. When and if they return, it could take the price to new highs as silver continues to play catch up with its precious cousin, gold.
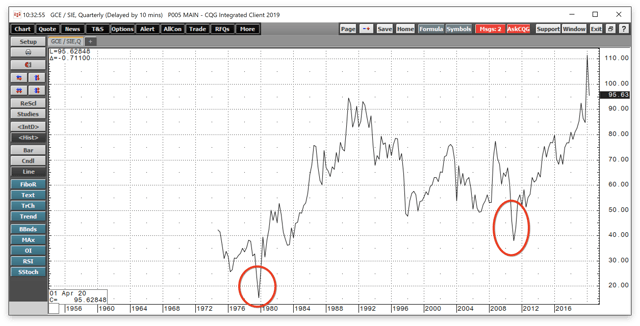
While many doubt the significance of the silver-gold ratio these days, the price relationship has a history of falling during bull market periods.
Source: CQG
The quarterly chart shows that the ratio reached a low of 15.47:1 in 1979. Silver was on its way to over $50 and gold to over $800 per ounce. In 2011, it reached a bottom of 38:1 when silver was on its way to a slightly lower high of $49.82, and gold to its all-time peak at $1920.70 per ounce. The initial reaction to the 2008 financial crisis was a move higher in the ratio.
Time will tell if silver and gold are heading much higher after the blow-off low in the silver market in March. The price action from 2008 could stand as a model for the coming months and years.
Parallels with 2008
At the start of the global financial crisis in 2008, the price of silver tanked from $21.185 to $8.40 during that year. Gold fell from $1033.90 to $681 per ounce. The prices of both precious metals took off to the upside from the 2008 lows and did not look back until reaching the 2011 highs at $49.82 and $1920.70 per ounce.
Central banks and governments injected massive amounts of liquidity into the global financial system in 2008, causing pressure on the value of fiat currencies. From June through September 2008, the US Treasury borrowed a record $530 billion to fund the stimulus. In May 2020, the Treasury borrowed five times that amount at $3 trillion. They will likely be borrowing even more in the coming months. If 2008 required waves of liquidity, COVID-19 is causing a tidal wave of central bank and government actions to stabilize the economy after a self-induced coma. Gold and silver prices soared from 2008 through 2011. We could look back at the 2020 lows in gold and silver at $1450.90 and $11.74 as the buying opportunities of a lifetime. The two metals have never traded at their respective 2008 lows since the crisis a dozen years ago.
The move to a record high in the silver-gold ratio and its subsequent retreat could signify that the relationship is now on a path downward. The prices of the metals may continue to make higher lows and higher highs over the coming months and years as the impact of the stimulus eats away at the purchasing power of the world’s fiat currencies.
If silver is going to lead, USLV on dips
I believe that any corrections in gold and silver will be buying opportunities in a continuation of bull market conditions in the precious metals. The first level of significant long-term resistance in the silver market stands at the 2016 high of $21.095 per ounce. It took silver until September 2010, two years from its 2008 low, to surpass the 2008 peak at $21.185. This time, it may not take as long given the underlying strength in the market. Gold broke out to the upside in June 2019 and has never come closer than $73.40 to revisiting its technical breakout level in 2020.
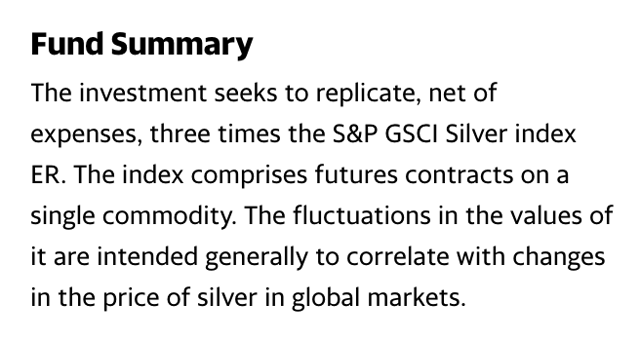
In bull markets, silver tends to take the lead from gold. From 2008-2011, gold moved 2.82 times higher, while silver’s price moved over 5.9 times higher. The most direct route for a trade or investment position in the silver market is via the physical market for bars and coins or the futures and futures and futures options market on the COMEX division of the CME. For those looking to magnify the price action on the upside in silver without venturing into the futures market, the Velocity Shares 3X Long Silver ETN product (USLV) provides an alternative. The fund summary for USLV states:
Source: Yahoo Finance
USLV has net assets of $222.3 million, trades an average of 907,461 shares each day, and charges a 1.65% expense ratio. DSLV is the inverse product, for those looking to magnify the downside of the market. The two products are trading tools for short-term risk positions in the silver market. Since they operate on leverage, time is your enemy with USLV and DSLV as they suffer from time decay when the market moves against them or remains static.
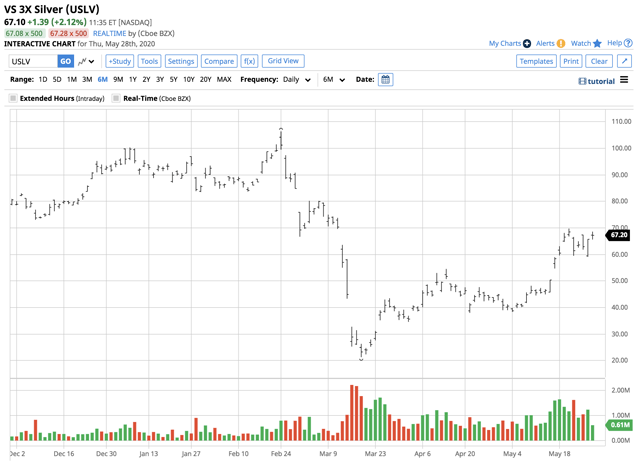
The price of nearby silver futures rallied from $11.74 in mid-March to a high of $18.11 in late May on the continuous futures contract, a move to the upside of 54.3% in a little over two months.
Source: Barchart
Over the same period, USLV appreciated from $21.30 to $69.75 per share or 227.5% as the ETF delivered a better than triple percentage gain.
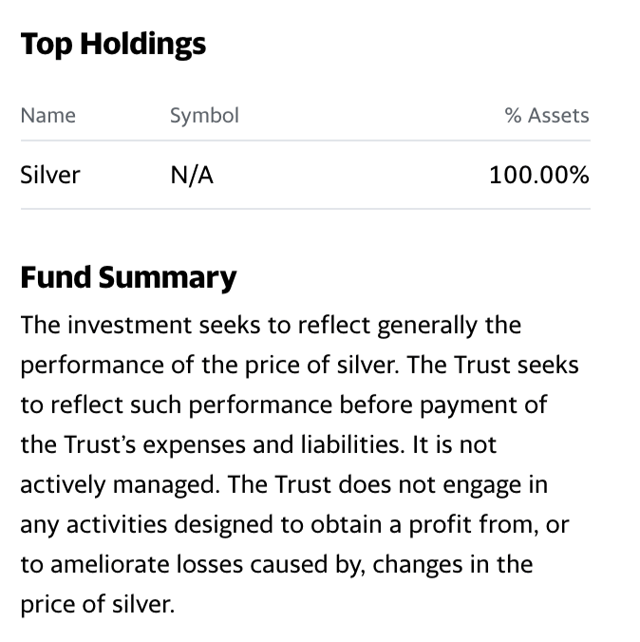
The fund summary and top holdings of the iShares Silver Trust (SLV) includes:
Source: Yahoo Finance
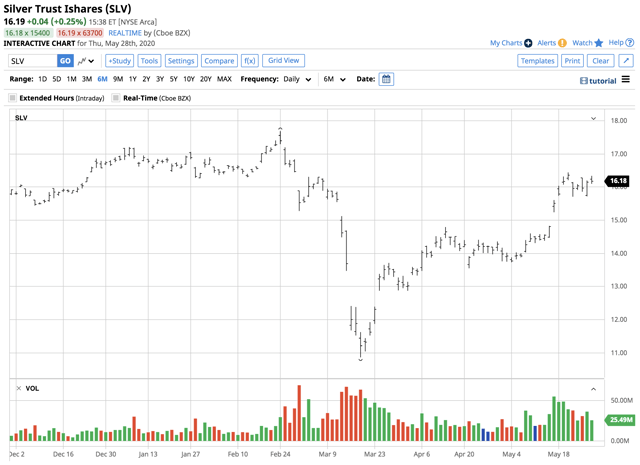
SLV has net assets of $6.33 billion, trades an average of over 30.4 million shares each day, and charges an expense ratio of 0.50%. Since May 9, silver moved 15.2% higher at the most recent peak.
Source: Barchart
Over the same period, SLV moved from $14.35 to $16.45 per share or 14.6%. SLV holds 100% of its net assets in silver bullion, and provides an unleveraged return compared to the price of the precious metal. I prefer the USLV product for short-term trading and the SLV product for medium to long-term investing purposes.
Stimulus is bullish for gold and silver prices. If 2008-2011 is a guide, we could see a significant move to the upside in the silver market over the coming months and years. USLV is a short-term trading tool that could enhance your returns when trading the precious metal from the long side of the market.
The silver-gold ratio has declined since its record high in March. In 2008, it rose to a high of almost 80:1 during the risk-off period when the stimulus from central banks pushed the relationship between the two precious metals to a low of below 33:1 in 2011. History rarely repeats precisely, but it does tend to rhyme over time. Silver was back at the $18 level on the July futures contract on Thursday, May 28.
The Hecht Commodity Report is one of the most comprehensive commodities reports available today from the #2 ranked author in both commodities and precious metals. My weekly report covers the market movements of 20 different commodities and provides bullish, bearish and neutral calls; directional trading recommendations, and actionable ideas for traders. I just reworked the report to make it very actionable!
Disclosure: I/we have no positions in any stocks mentioned, and no plans to initiate any positions within the next 72 hours. I wrote this article myself, and it expresses my own opinions. I am not receiving compensation for it (other than from Seeking Alpha). I have no business relationship with any company whose stock is mentioned in this article.
Additional disclosure: The author always has positions in commodities markets in futures, options, ETF/ETN products, and commodity equities. These long and short positions tend to change on an intraday basis.
The author is long silver and gold