USD/INR New York Price Analysis: Greenback eyeing the May’s lows vs. Indian rupee
by Flavio Tosti- USD/INR keeps moving down on broad-based USD weakness.
- The level to beat for bears is the 75.50 support.
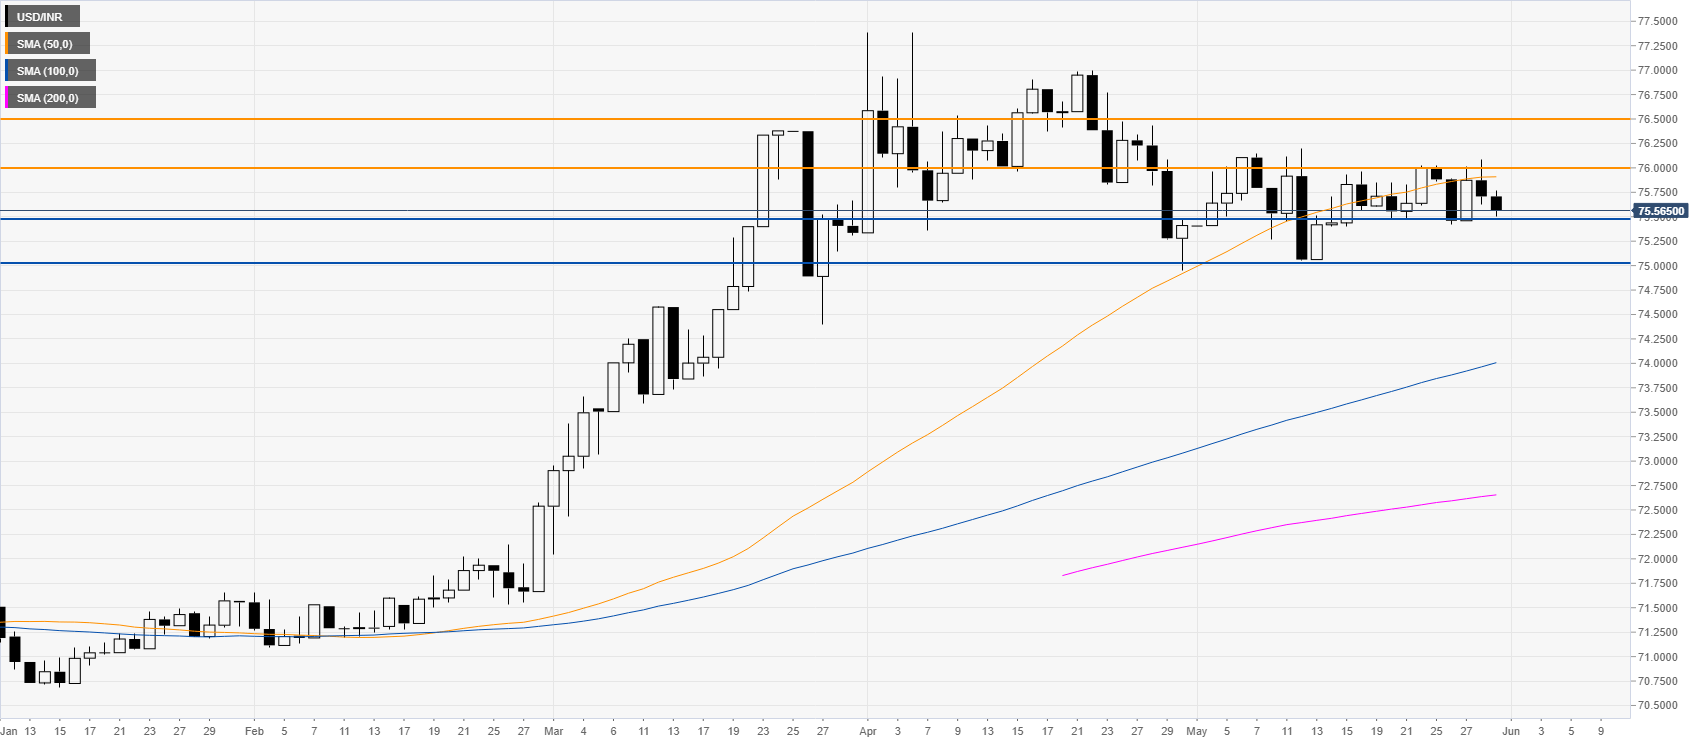
USD/INR daily chart
USD/INR is retreating further below the 76.00 figure as the spot is having a hard time to find a clear direction in May while the quote stays confined in the 75.00/76.00 range. However, a daily close below the 75.50 support can lead to intensifying selling with 75.00 as a potential target. On the other hand, strong resistance is seen near the 76.00 figure.

Additional key levels
USD/INR
| Overview | |
|---|---|
| Today last price | 75.5677 |
| Today Daily Change | -0.1403 |
| Today Daily Change % | -0.19 |
| Today daily open | 75.708 |
| Trends | |
|---|---|
| Daily SMA20 | 75.6895 |
| Daily SMA50 | 75.8767 |
| Daily SMA100 | 73.993 |
| Daily SMA200 | 72.6493 |
| Levels | |
|---|---|
| Previous Daily High | 76.0834 |
| Previous Daily Low | 75.6267 |
| Previous Weekly High | 76.0223 |
| Previous Weekly Low | 75.4707 |
| Previous Monthly High | 76.975 |
| Previous Monthly Low | 75.14 |
| Daily Fibonacci 38.2% | 75.8012 |
| Daily Fibonacci 61.8% | 75.9089 |
| Daily Pivot Point S1 | 75.5287 |
| Daily Pivot Point S2 | 75.3493 |
| Daily Pivot Point S3 | 75.072 |
| Daily Pivot Point R1 | 75.9854 |
| Daily Pivot Point R2 | 76.2627 |
| Daily Pivot Point R3 | 76.4421 |