Learning From The Ups And Downs Of The Stock Market
by Kevin MahnSummary
- Thus far in 2020, the stock market has experienced daily moves of 1.5% or more (up or down) 43% of the time.
- Of the 100 trading days thus far in 2020, 53 have been "up days" while 47 have been "down days"
- Trying to successfully time when to exit and then re-enter the market is often an exercise in futility.
- Time in the market, as opposed to market timing, is often more important for longer-term investors.
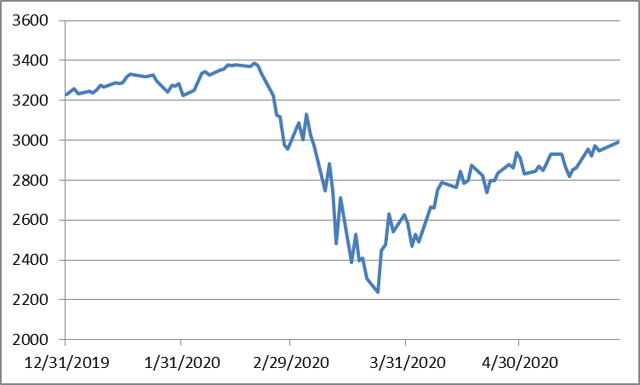
The S&P 500 Index (S&P 500) closed at a level 2991.77 on May 26, 2020, representing a daily gain of 1.23%, thanks in large part to renewed optimism on economic re-openings and the potential for additional vaccine candidates from the likes of Novavax and Merck. As it stands now, it looks like the low close for the S&P 500 in 2020 year-to-date (YTD) is 2237.40, which occurred on March 23, 2020. These two S&P 500 data points mean that the S&P 500 has rallied nearly 34% off of its March low. However, just as the coronavirus crash did not follow a straight trajectory downward, the ensuing rally has not followed a straight trajectory upwards - quite to the contrary in fact. Consider the trading activity of the S&P 500 Index in 2020 below through the close of business on Monday, May 26, 2020.
In summary, of the 100 trading days thus far in 2020, 53% have been "up days" while 47% of them have been "down days" and the % magnitude of the daily changes have been significant at times. As evidence of the extent of the whipsaw volatility that has taken place in the stock market thus far this year, consider that 43% of the time the market has moved by more than 1.5%; up or down, in a given day versus the prior trading day.
Summary of S&P 500 Index Daily Trading Activity 2020 YTD
| Total # of trading days: | 100 |
| # of up days: | 53 |
| # of down days: | 47 |
| Longest stretch of consecutive up days: | 4 |
| Longest stretch of consecutive down days: | 7 |
| # of up days between +0.00% and + 0.50%: | 17 |
| # of up days between +0.50% and + 1.00%: | 8 |
| # of up days between +1.00% and +1.50%: | 10 |
| # of up days greater than +1.50%: | 18 |
| # of down days between -0.00% and -0.50%: | 11 |
| # of down days between -0.50% and -1.00%: | 8 |
| # of down days between -1.00% and -1.50%: | 3 |
| # of down days greater than -1.50%: | 25 |
| Largest up day - % daily gain (date): | +9.38% (March 24, 2020) |
| What happened on the day after the largest up day: | +1.15% |
| Largest down day - % daily loss (date): | -11.98% (March 16, 2020) |
| What happened on the day after the largest down day: | +6.00% |
The line graph below of the daily closes of the S&P 500 between December 31, 2019 and May 26, 2020 will show the roller coaster ride that investors have been on in 2020 even better.
S&P 500 Index Daily Close Levels 2020 YTD

It should also be noted that despite the current rally off of the March 23, 2020 low, the S&P 500 Index still remains approximately 7.4% lower than its closing level of 3230.78 on December 31, 2019. As a result, an additional rally of 7.9% from the close on May 26, 2020 would be needed to bring the S&P 500 back to flat from where it began 2020. That rally, if it were to occur, would likely follow a similar bumpy path as the days of heightened volatility are likely not behind us.
In my view, all of the data above can serve as a helpful reminder to investors of the importance of time in the market and the dangers of trying to time the market when navigating these types of volatile markets. Trying to successfully time when to exit and then re-enter the market is often an exercise in futility and could result in missing out on some of the best "up days" that a market cycle may have to offer.
Disclosure: I/we have no positions in any stocks mentioned, and no plans to initiate any positions within the next 72 hours. I wrote this article myself, and it expresses my own opinions. I am not receiving compensation for it. I have no business relationship with any company whose stock is mentioned in this article.
Additional disclosure: Disclosure: Data sourced from Bloomberg as of May 26, 2020. Performance data is price-based, not total return based, and does not include dividends. "Up days" indicate a closing level above the closing level of the previous trading day. "Down days" indicate a closing level below the closing level of the previous trading day. Past performance is not an indication of future results. You cannot invest directly in an index. The accuracy of this information is from sources we believe to be reliable but is not guaranteed.