Have No Fear Of Missing Out
by Eric Parnell, CFASummary
- The S&P 500 appears to be breaking out to the upside. New all-time highs ahead?
- The fundamental reality not only challenged but is also in sharp contrast to recent stock performance.
- How to avoid the fear of missing out given these conflicting economic and market forces.
Relentless. The U.S. stock market as measured by the S&P 500 Index is continuing its remarkable run. With states across the U.S. working in the process of reopening their economies now several months into the COVID-19 crisis, is the upside in U.S. stocks just getting started? And what are ways that investors can position in today’s market?
Breakout! The performance of the S&P 500 over the past week has been impressive to say the least. Stocks have been resilient to the point of being eyebrow-raising.
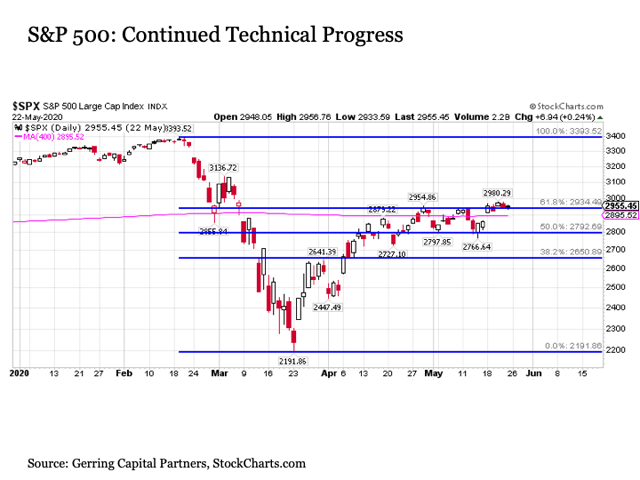
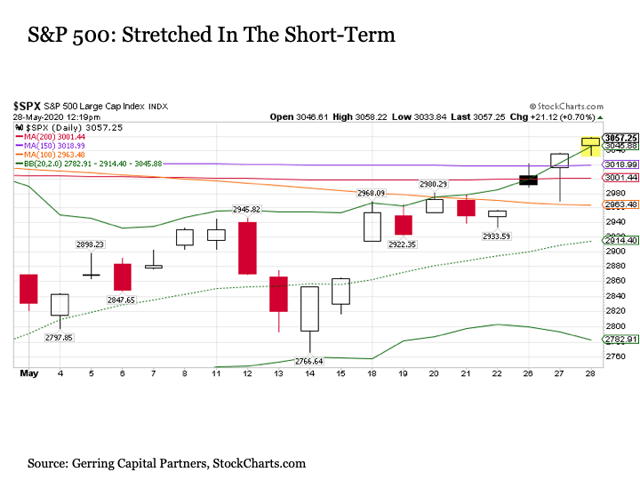
From a technical perspective, the U.S. large cap stock benchmark entered the week trading at 2955 and having appeared to successfully have cleared its ultra long-term 400-day moving average resistance (pink line) on its fourth try over the past month. In the process, it also managed to successfully climb above its 61.8% Fibonacci retracement level on its third attempt.
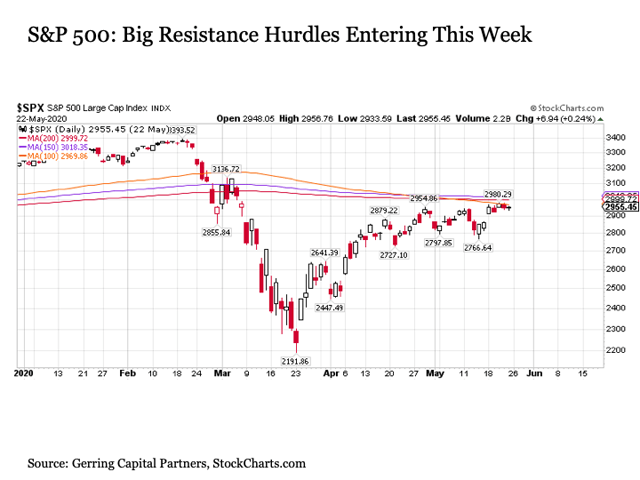
The S&P 500 still had a far more daunting set of resistance hurdles straight ahead heading into the current trading week, however. This included a trifecta of key technical resistance levels including the downward-sloping 100-day moving average (orange line) at 2969 and falling, the long-term 200-day moving average (red line) at 2999 that resided just one S&P point below the psychologically significant 3000 level, and the downward-sloping 150-day moving average (purple line) at 3018.
Given the heavy thicket of key resistance levels all clustered together within a less than fifty S&P points range, it was reasonably expected that the S&P 500 may be facing a back-and-forth trading grind at best in the coming trading days if not weeks, particularly given that it took over a month for the S&P to finally clear the previous 400-day and Fibonacci resistance levels mentioned above.
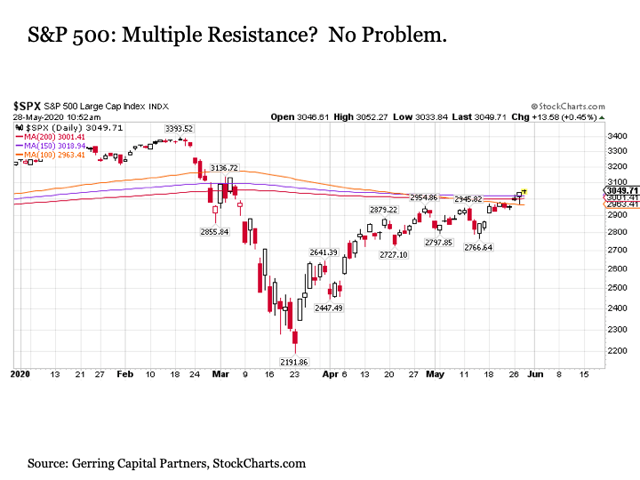
It turns out the S&P 500 remains a stock market index that simply will not be denied. Over the first two trading days of the week and continuing into the start of the third, the headline benchmark quickly breezed right past all three technical resistance levels with barely a fight. This is a notable development to say the least. For just as it was jarring back at the end of February and beginning of March how quickly the S&P 500 plunged below all of its key support levels, it is equally disquieting that the index is just as easily surging back above these same resistance levels (from a technical perspective, what was once support becomes resistance and vice versa).
So why is this possibly a problem? Just as it was on the way down when stocks were not finding logical buying pressure to stem the decline, the fact that stocks are not encountering logical selling pressure on the way back up indicates that we are operating in a market that is still dislocated. And when the market is not behaving as it typical does and presumably should when moving in either direction, it suggests that we must be prepared for further unpredictability from stocks going forward.
What does this mean for stock investors? It has been said that you should never invest in a business that you don’t understand, but the dilemma becomes far more complicated when the entire S&P 500 is trading in a way that we cannot understand. At least when stocks were falling in February and March, it was consistent with the underlying economic reality that was rapidly unfolding. And while we can certainly humor such explanations like stocks are “rising in anticipation of economies reopening” or “advancing in anticipation of economic improvement over the coming year”, frankly these are largely nonsense.
You might get some buying support on the margins from these notions that could help stabilize markets at more reasonable valuations, but not the strong and resilient blast-off style upside advances at increasingly premium valuations that we have seen on so many trading days during the bounce. And this is particularly true today given the vast minefield of accumulating systemic downside risks that lie ahead as far as the eye can see.
Yes, the outlook has become even more uncertain, not less – ask the people in Hong Kong and those in the U.S. that do business in China right now as just one of so many examples. In short, despite all of the newfound euphoria, stock investors need to be really careful out there right now, as this is a market that defies fundamental explanation.
What is driving stocks higher then? For those of you that have read my articles on Seeking Alpha over the past decade, I apologize in advance for replaying the broken record once again. It is first and foremost the Fed. Below is the latest update on the power of Treasury purchases in driving today’s bounce.
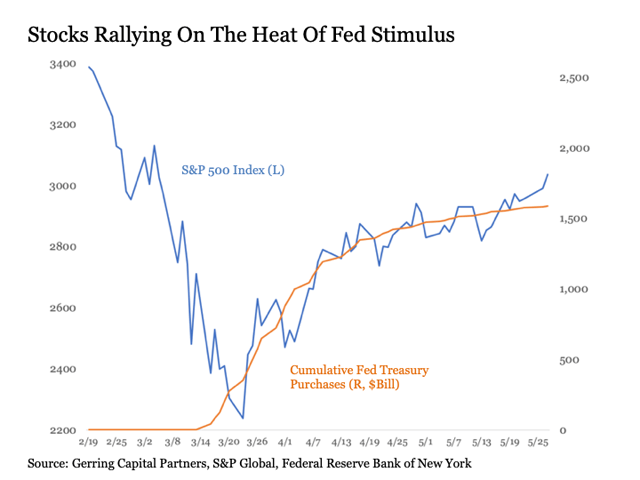
While the Fed is no longer buying Treasuries at the gobsmacking pace of $75 billion per day like they were back in late March, they are still gobbling up $5 billion a day in Treasury purchases for a total of $20 billion during this holiday-shortened trading week. Given that the Fed has tapered by $1 billion per day each week dating back to the start of May, it would be reasonable to expect that they will take the next step back to $4 billion per day for a total of another $20 billion next week from June 1-5. And this is likely enough at least in the short term to maintain a bid under U.S. stock prices.
What else? Of course, it would be nearsighted to not consider other forces that may also be playing their part in pushing stock prices higher lately. For example, it has been noted that idle sports bettors have turned to the stock market to help scratch their gambling itch – what downside risk this may imply for stocks such as General Electric (GE), Disney (DIS), and Ford (F) once sports like the NBA and NHL potentially resume sometime this summer remains to be seen – although it is unlikely that they are doing so with sufficient volume and capital to be making more than a minor dent in market movements.
Getting better. But another factor that is likely playing an important part in supporting the stock rally is the gradual decline in COVID-19 daily new cases in the U.S. dating back to the first early April peak. Consider the following chart below that shows the S&P 500 dating back to the February 19 stock market peak against a chart of COVID-19 daily new cases in the U.S. shown inverted with a ten-day lead. In other words, the stock market low on March 23 is shown against the number of new COVID-19 cases in the U.S. that came ten trading days later on April 6.
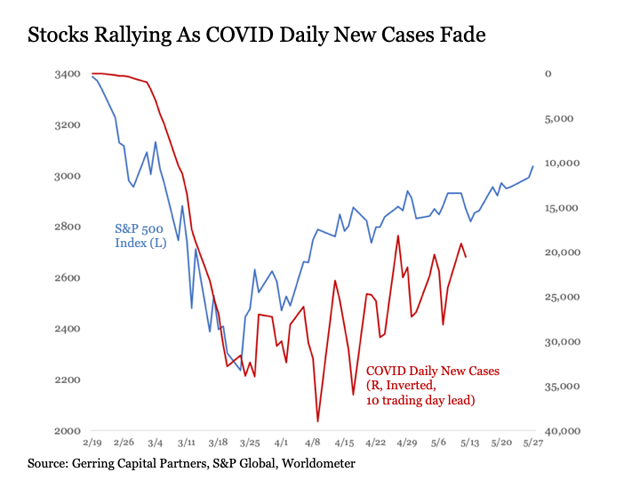
The stock market is supposedly a forward-looking indicator, and it appears in this instance that the S&P 500 could have been looking ahead over the coming weeks and anticipating that COVID-19 daily new cases in the U.S. would finally peak and start moving back lower. This is a very reasonable explanation for rising stock prices to be sure.
Or actually getting worse. If this truly is a reason why stock prices have been rebounding, then the S&P 500 may not only be overlooking an important reality, but it may be setting up for disappointment as state economies increasingly reopen. Consider the following chart of COVID-19 daily new cases in the U.S., but with the two states of New York and New Jersey excluded from the total.
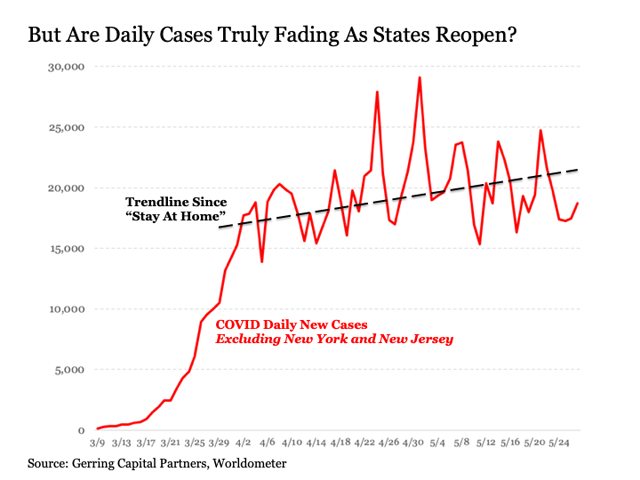
Unfortunately, when excluding these two states that resided at the epicenter of the COVID-19 crisis thus far in the U.S., we see that COVID-19 daily new cases are not declining at all. On the contrary, the trendline dating back to March 30 at the point when many states capitulated and entered into “stay at home” orders has actually continued to steadily rise outside of NY and NJ.
What does this potentially mean? Disturbingly, it suggests that so many of us across the country that endured the social and economic hardship associated with “stay at home” orders over the past two months so that we could buy time to “flatten the curve” the way that countries from Taiwan to South Korea to New Zealand to Germany to Italy to Spain among so many others were able to successfully achieve while also providing officials with time to develop effectively coordinated national testing and tracing programs to help contain the further spread of the virus when state economies reopened may have engaged in all of this sacrifice for effectively little to nothing to show for it when it’s all said and done.
For if COVID-19 daily new case levels were rising across the U.S. on net outside of a few select areas throughout the “stay at home” period, it bodes most poorly for how the virus is likely to unfold in the coming months ahead as state economies increasingly reopen, particularly true given that a coordinated testing and tracing program remains virtually non-existent and regardless of how much intangible factors such as the open air that comes with warm summer weather might help at the margins along the way.
Words cannot express as a resident of the United States how deeply frustrated this potential reality for this country makes me. Yet the S&P 500 continues to surge relentlessly higher despite it all. Forward-looking. Got it.
A key reason to remain allocated to stocks. Regardless of the reasons why, the reality is that the S&P 500 remains determined to advance higher. As Jesse Livermore once said, “it is not good to be too curious about all of the reasons behind stock price movements.” The U.S. stock market has a consistent track record dating back more than a decade since the Great Financial Crisis (GFC) of steadily rising no matter how dire the underlying economic reality, and we have long known the reason why in the Fed. And it seems that a potential economic outcome that some are referring to as the “Greater Depression” may be no exception.
The S&P 500 is once again overdue for a pullback. Even with these considerations in mind, it is worthwhile to note that stocks are once again overdue for at least a short-term pullback. And they are becoming increasingly challenged from a long-term fundamental perspective even if the best-case scenarios start to unfold with the ongoing COVID-19 crisis from here.
First, from a short-term perspective, the impressive advance by the S&P 500 above the three key resistance levels this week has it trading well above its top Bollinger Band, thus imply that the S&P 500 would be trading this high less than 2.5% of the time. In other words, the S&P 500 would typically be trading lower than it is now more than 97.5% of the time. As a result, a short-term pullback to around 2914 to around 2782 on the S&P 500 should not be ruled out in the near term purely for technical reasons.
Next from a longer-term perspective, the S&P 500 increasingly has a valuation problem. While stocks can ignore valuations for an extended period of time, the precipitous -35% decline in the S&P 500 from February 19 to March 23 shows how valuations can suddenly matter a lot once the market winds shift, as stocks likely would have fallen a whole lot less during this period if they were trading at more reasonable multiples instead of some of the highest valuations in market history as they were on February 19.
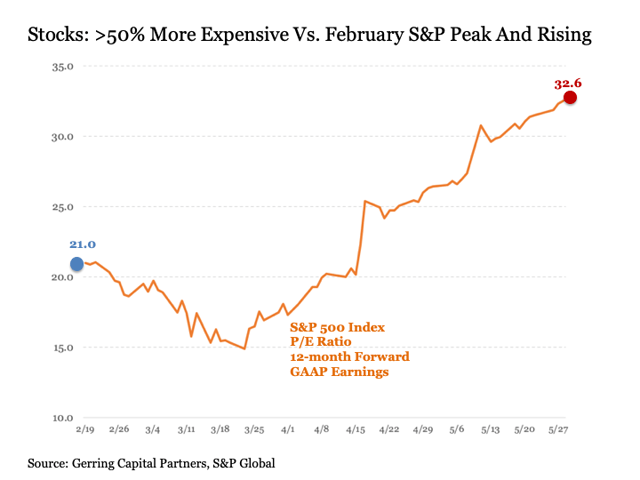
With this in mind, consider the chart above that shows the S&P 500 price-to-earnings (P/E) ratio based on 12-month forward GAAP earnings. At the market peak on February 19, the S&P 500 was trading at a historically rich 21 times forward earnings. While valuations did come back toward historically average levels during the market decline in March, they have exploded higher in the two months since. This has been due not only to the rising “P” of the S&P 500 Index but also the falling “E” of forecasted earnings for the S&P 500 over the coming year. As a result, the S&P 500 is now trading at an astonishingly high 32.6 times forward earnings. This is more than 50% higher than the nosebleed valuations that were in place at previous all-time highs on February 19, which was a time when the economic outlook was far more optimistic than it is now.
How much more optimistic? While evidence had been accumulating that the U.S. economy was slowing, consider back on February 19 when the S&P 500 was at a record that the U.S. economy was still coming off of registering an all-time high real GDP print of $19.2 trillion. Fast forward three months later, and the first read on 2020 Q1 real GDP growth at -4.8% is already in the books. More significantly, forecasts for 2020 Q2 real GDP growth is expected to come in anywhere between -30% according to the New York Fed Nowcast and -42% according to the Atlanta Fed GDP Now projections.
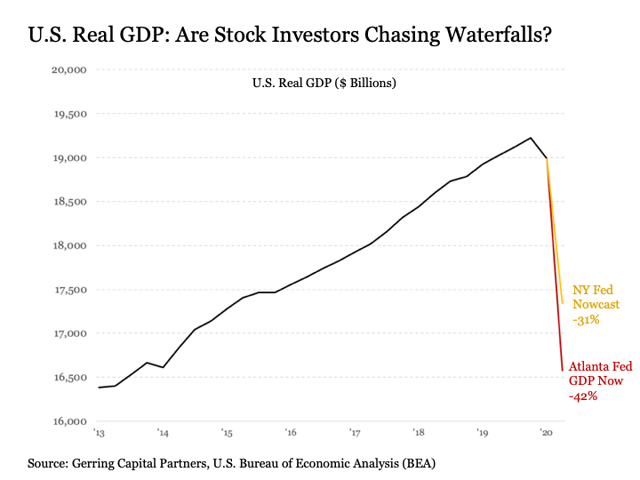
Either outcome will bring the U.S. economy back to anywhere between mid-2013 to early-2015 output levels at a time when the S&P was trading between 1600 and 2100. Optimists are banking on the U.S. economy quickly bouncing back to pre-pandemic levels rather quickly. I am concerned, however, that it may end up taking longer for output to bounce back than some may anticipate. This would be a challenging backdrop for stocks if they were trading at discounted valuations. The fact that they are trading at historically high valuations makes the obstacles ahead all the more daunting.
As a result, investors that may be inclined to wade deeper into the S&P 500 waters today should recognize the fact that they are buying at a time when the market is already stretched by many measures, COVID-19 or no COVID-19, and may confront much bigger challenges in the months ahead (and I haven’t even talked about the looming corporate default wave among other risks).
Have no fear of missing out. None of this helps address the understandable human instinct that can be so hard to manage when it comes to stock investing. “The stock market keeps rising and I have the fear of missing out!”. FOMO! Let’s explore this topic further.
The following are three key considerations to help eliminate the fear of missing out on the U.S. stock market (or any other asset class for that matter) at any given point in time.
First, you should already own stocks. One of the best way to avoid the fear of missing out on a rising stock market is being allocated to the stock market. In fact, your portfolio should be allocated to stocks virtually at all times.
But how can this make sense? If you are bearish on the stock market, why would you want to own stocks? Because they are a critically important asset class within financial markets that require an allocation at all points in time. And while you may be convinced that stocks should be moving to the downside, it is very possible as the current market is demonstrating that they may defy your expectations and will move relentlessly to the upside. So even if you are bearish, by maintaining an allocation to stocks, you are hedging against this upside risk.
It is important to take this point about a dedicated allocation to stocks one step further. Maintaining an allocation to stocks is not the same as overweighting to stocks. In other words, maintaining your allocation to stocks involves optimizing the weighting from an expected risk-adjusted return perspective within the framework of a broader portfolio allocation strategy that incorporates numerous uncorrelated asset classes. If, on the other hand, you have an overweighting with a vast majority of your portfolio allocation to stocks (60% to 70% or more) and are bearish, then considering a portfolio reallocation that meaningfully reduces this allocation would likely be warranted. But this would be true from a portfolio optimization standpoint in my view regardless of whether the stock market was ripping higher, dipping lower, or grinding sideways.
Second, you should be selective in the stocks that you own. It is true that the S&P 500 is ripping higher. And if the only way that you could invest in stocks was to own the S&P 500 Index, this would be a problem. Fortunately, five-hundred individual stocks make up the S&P 500 Index, and they can be compartmentalized into different styles (growth, value), sectors (energy, health care, technology, etc., etc.), and specialized categories, all of which are readily investible and highly liquid. Moreover, the worldwide stock marketplace offers a variety of categories and subcategories beyond the S&P 500 all around the globe that are also investible and highly liquid.
This wide-reaching way to slice and dice your stock allocation is particularly important as it relates to the current market environment. Consider the following. Say you see the S&P 500 ripping higher today and you want to allocate to the market. My first suggestion would be to forgo the SPY, IVV, and VOO. They are too expensive and a bit off the rails right now.
Instead, you might start with a look at the industrials (XLI) and transports (IYT) within the U.S. stock market.
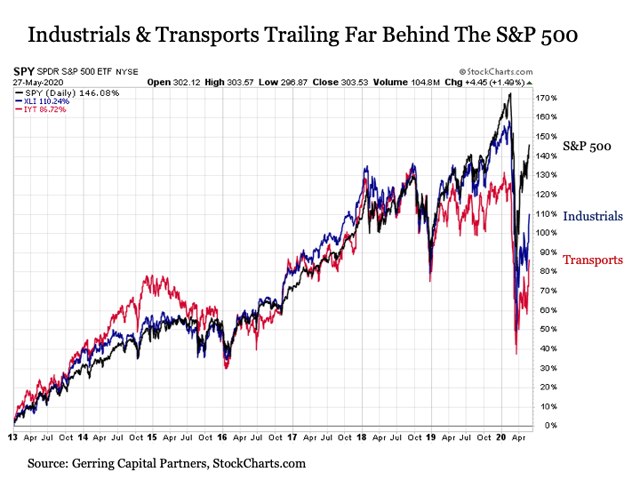
Historically, industrials have moved in virtual lockstep with the broader S&P 500 with a correlation coefficient of +0.98. But their cumulative returns over the past few months have industrials trailing the S&P 500 by an extraordinary 36 percentage points. As for the transports, they have historically served as a leading indicator for the path of the broader market. Since the beginning of 2019, they have trailed the broader S&P 500 by an increasingly widening margin and are now more than 60% percentage points below the broader S&P 500 on a cumulative return basis.
While the bearish among us might view these developments as an unsustainable disconnect requiring the S&P 500 to fall back down to levels being implied by industrials and transports, a more bullish view would be that allocating to industrials and transports could be an ideal way to capture attractive values as these trailing segments catch up with the broader market.
Maybe you’d rather not make a sector bet and wish to maintain a broad allocation. Look no further than the equal weighted S&P 500 Index (RSP), that has increasingly disconnected to the downside from the broader market.
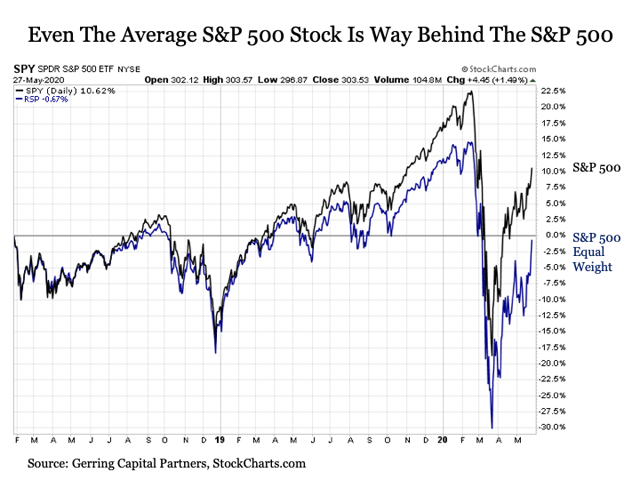
The bearish among us might view this dislocation as signs of an increasingly concentrated broader market that is clinging to its last bullish gasps of air before finally rolling over. The more bullish view would be that while the headline S&P 500 is racing higher, the index still contains many components that are trailing behind and can still be had at a more reasonable price as broader market continues its march higher.
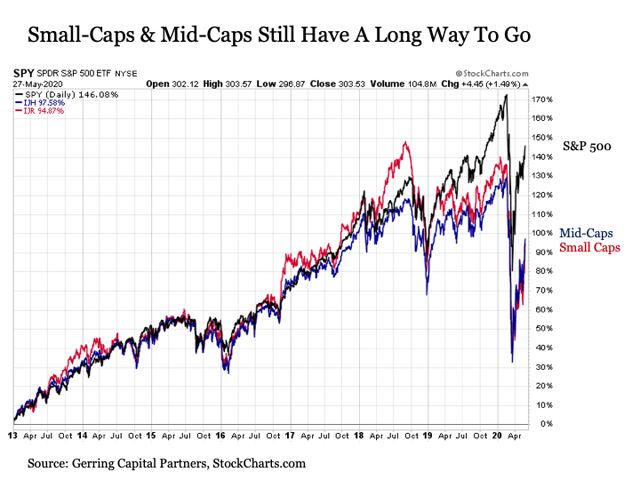
Suppose you think the S&P 500 has simply come too far, too fast and you want no part of it, but yet you remain optimistic about the future prospects for the economy. Perhaps then you might consider U.S. mid-caps and U.S. small caps, which are still running about 50 percentage points behind the U.S. large caps on a cumulative return basis. Never mind that small-caps and mid-caps typically lead large caps during a recovery phase.
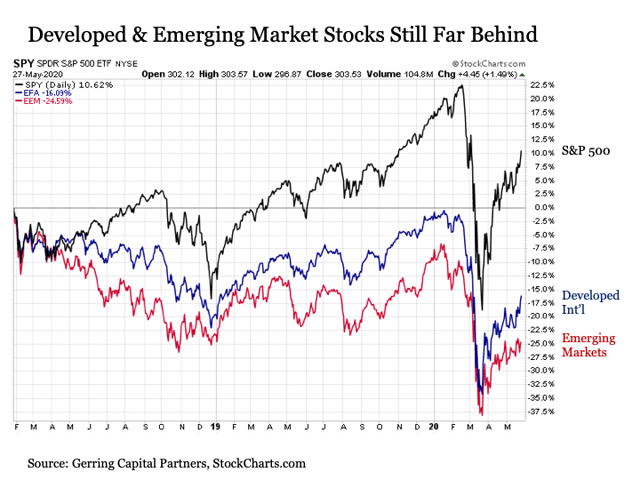
Or if you think the world has blue skies ahead, then perhaps developed international and emerging market stocks may be worth a look, as they are relatively much less expensive versus the S&P 500 at 15 times and 13 times earnings, respectively, and are still trapped in bear markets that are already running at two years and counting. Of course, these non-U.S. markets have been attractively valued relative to the U.S. throughout most of the entire past decade, and this discount has provided investors with nothing other than a “value trap” to date.
Lastly, know that stocks are just one of many asset classes to consider. Stocks get all of the attention. But capital markets are filled with a variety of uncorrelated asset classes that offer attractive total returns opportunities in their own right while following a path that is largely independent of the U.S. stock market.
Still reeling from the double trauma U.S. stock market trauma of 2018 Q4 and February-March 2020? Consider the total cumulative returns experience of long-term U.S. Treasuries and gold over this same time period in the last 18 months. Steadily higher with cumulative gains that have been three times or more that of the S&P 500 Index.
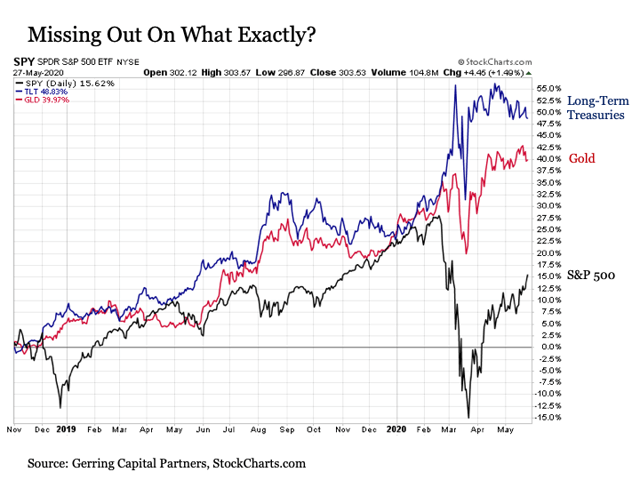
So does this mean that you should have owned long-term U.S. Treasuries and gold instead of U.S. stocks over the past 18 months? Absolutely not. It means that you would have been well-served to have owned all three categories along with other categories all along the way. The key is to not have too much or too little of any of these categories in your overall portfolio blend at any point in time. This is where risk management comes into play.
Bottom line. Make no mistake. I’m bearish. I think any stock market rise above the 2900 to 3000 range on the S&P 500 is a façade that eventually ends badly based on the fundamental reality that is not only not going away but has the potential to get worse before it starts getting better. It may end badly for stocks starting tomorrow, this summer, or sometime in 2022 or beyond when the latest Fed-induced asset price sugar high ends in an even greater and swifter COVID-19 February-March stock market crash trauma. Only time will tell. And I recognize that the S&P 500 remains staunchly determined to rise in the meantime.
With that said, I have been actively looking to buy stocks to add to those that I already own. Not the S&P 500 Index itself, but individual stocks that are being carefully selected based on their sector, quality, volatility, and value characteristics. And I am considering adding any new positions within my dedicated target allocation to stocks as part of the broader portfolio framework. This is an approach that I will continue to take regardless of whether the S&P 500 is trading at 2500 or 3500 in the months ahead. After all, no matter how high the stock market may climb, it typically has something on offer at a good value.
I should also note that I am simultaneously considering inverse allocations to selected stock market segments as an added hedge against these long stock allocations to further focus on individual upside opportunities while also protecting against broader market downside risk that may arise going forward.
Thus, regardless of whether you are bullish or bearish on stocks, you can have no fear of missing out on whatever the S&P 500 (or any other asset class) might be providing at any given point in time by maintaining an emphasis on broad portfolio diversification.

Do you have a plan to navigate what may be left of today’s bull market while also positioning for the bear market that is now underway?
Come join us on Global Macro Research, where we apply a contrarian investment approach in preparing for risk in the future while positioning for opportunity today. Members receive our:
· Monthly Macro Outlook
· Monthly Portfolio Review
· Chat Sessions
· Special Reports
Special limited time offer: I am offering a FREE TWO-WEEK TRIAL from now until the end of the weekend on Sunday, May 31 at Midnight PT.
Sign up today and prepare for the road ahead.
Disclosure: I am/we are long TLT, PHYS, SH. I wrote this article myself, and it expresses my own opinions. I am not receiving compensation for it (other than from Seeking Alpha). I have no business relationship with any company whose stock is mentioned in this article.
Additional disclosure: I am long selected individual stocks as part of a broad asset allocation strategy.
Disclosure: This article is for information purposes only. There are risks involved with investing including loss of principal. Gerring Capital Partners and Global Macro Research makes no explicit or implicit guarantee with respect to performance or the outcome of any investment or projections made. There is no guarantee that the goals of the strategies discussed by Gerring Capital Partners and Global Macro Research will be met.