VIXM: Here's Why It Is Likely Going To Keep Dropping
by QuandaryFXSummary
- VIXM has had a strong year due to the historic rally in the VIX.
- VIXM tracks the Mid-Term VIX Futures Index, which allows it to reduce roll yield at the cost of diminished correlation to the VIX.
- VIXM’s methodology declines at an annualized rate of 20%, which means that the recent rally is likely to be erased in the coming months.
As seen in the following performance table from ProShares, the VIX Mid-Term Futures ETF (VIXM) has had a decent year due to the VIX rallying to one of the highest levels ever seen.

It is my opinion that VIXM is headed lower from here. I believe that VIXM has a methodology which ultimately is unable to be a long-term viable positive investment, and it is my view that going forward, investors should look to sell out of positions in this ETF.
Understanding VIXM
It’s been several months since I’ve written about VIXM, so I want to start this piece off with a deep dive into the methodology of the ETF. Put simply, VIXM is a fairly complicated instrument, and it takes a somewhat deep study of the various factors at work in the instrument to ultimately understand its composition and trajectory.
To start off with the basics, VIXM follows the VIX Mid-Term Futures Index provided by S&P Global. This index gives the return of constantly rolling exposure across the fourth- through seventh-month VIX futures contracts, as can be seen in the current table of holdings.

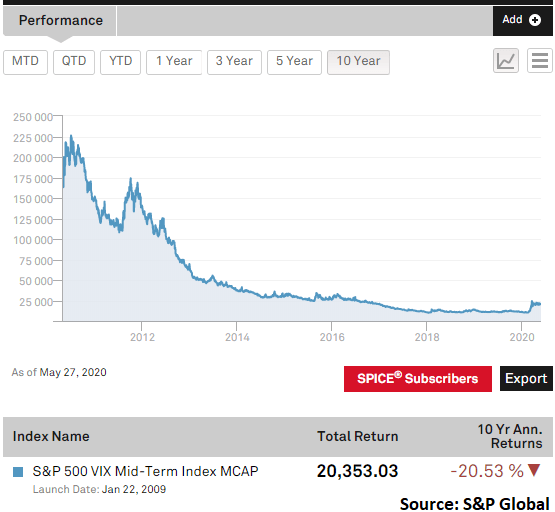
The underlying methodology which VIX follows has an unfortunate tendency: it drops through time fairly consistently.

As you can see in the above chart, VIXM’s methodology generally loses value through time. To understand why this is the case, we need to look no further than the ProShares’ own material for an explanation.

As can be clearly seen, VIXM is following an index which is expected to decline through time. As seen in the previous chart, historical data puts its annualized declines in the territory of 21% per year for the last decade, even including the strong rally seen this year.
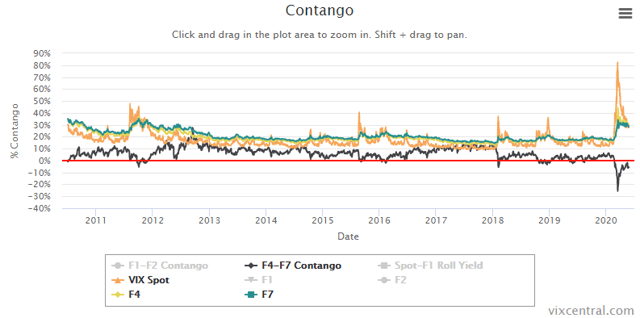
The reason for this decline is, of course, as noted by ProShares, roll yield. Roll yield is what you get when you’re holding exposure along a futures curve and the price of futures converges towards the spot price. For a practical example of this concept, here is a chart from VIX Central which shows the current differential between both the M4 and M7 VIX futures contract, as well as the differential between these contracts versus the spot level of the VIX.

This chart shows 10 years of historical data for the underlying prices of the index which VIXM tracks. Over the past 10 years, you can see that on average, the fourth through seventh futures contract months tend to be both above the spot level of the VIX as well as in contango when measured from a M4 to M7 basis.
We are currently in a very rare period of time in that the M4 VIX futures contract is in backwardation as compared to the M7 VIX futures contract. It’s important to note that with VIX futures, any backwardation seen along the futures curve is a fleeting occurrence, and periods of backwardation tend to be reversed in fairly short order. For example, there have only been a handful of other occasions in which the VIX M4 vs. M7 spread went into backwardation, and these instances were reversed within a fairly short time period.
Investors may be tempted to look at the M4 to M7 spread being in backwardation as a Buy signal for VIXM, but I believe this is a mistake. Specifically, I believe that the data strongly suggests that even if M4-M7 is in backwardation, overall roll yield still indicates that you will see losses. The reason for this is that the data strongly suggests that despite the relative shape between months on the curve, the overall curve will decline in value in relation to the spot price if the contracts are in contango versus the spot.
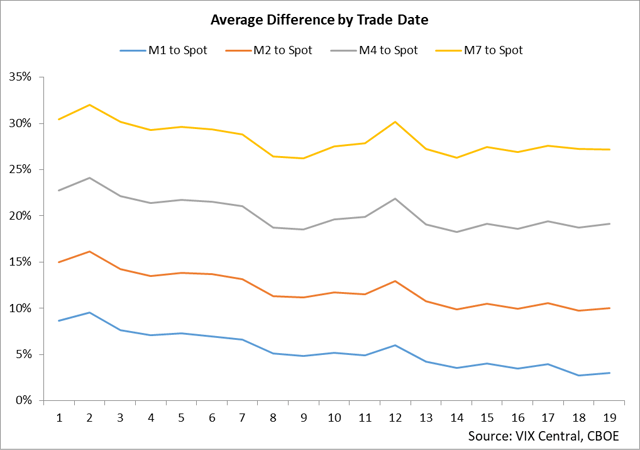
For example, here is a chart which shows the average differential between the major VIX futures contracts versus the spot level of the VIX by the trade day of the month.

This data essentially shows how VIX futures have priced versus the spot VIX for the past decade during a normal month. If you run the numbers, what you’ll find is that across the curve, you do see futures prices roll down towards spot by declining in value, but the impact of this roll-down diminishes the further out along the curve you look.
For example, the M1 contract tends to fall by about 5-7% in a typical month when compared to the spot price. However, the M7 contract only falls by about 2-3% during that same time period. What this basically means is that even if you’re holding exposure further out along the curve in the hopes of reducing roll yield, you still are impacted by it, albeit to a lesser degree. Also, the data generally shows that despite the specific relationship between M4 and M7 along the curve, futures still ultimately converge towards the spot price. In other words, even if M4 is above M7, each of the contracts us almost always above the spot VIX, and therefore, that difference is narrowing through time.
This, in a nutshell, is both the appeal of VIXM as well as its detriment. VIXM reduced roll yield when compared to popular alternatives trading the Short-Term VIX Futures Index (which holds M1-M2 and declines at an annualized rate of about 45-50% per year). However, the simple math shows that it declines at around 20% per year because it is almost always in contango versus the spot price and, therefore, gradually converging by dropping.
Furthermore, VIXM is hit by a little-observed factor, and that is the diminished correlation to the underlying changes in the VIX.

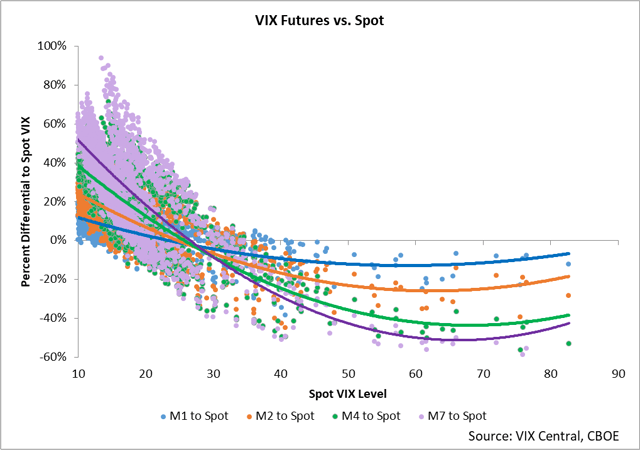
This chart contains a lot of information, but it’s important to implicitly grasp the data because it gives an understanding of why VIXM won’t necessarily track the changes in the VIX as well as short-duration VIX ETPs.
The first message this chart conveys is that the short-term VIX futures contract correlate more closely with changes in the VIX, as seen by the outright differential between the two data points. For example, when the VIX is very low, the front VIX contract tends to be about 10% above the spot VIX. And when the VIX is very high, the front-month VIX futures contract tends to be about 10-15% below the spot level of the VIX.
But when you widen the window to look at the M4 and M7 to spot VIX calculations, you’ll see that while the relationship of contango and backwardation versus VIX level tends to be the same, the magnitude of the differentials is substantially more. The reason here is that volatility tends to occur mostly in the front of a futures curve, and the further out along the curve you look, the less the futures contracts ultimately mirror the underlying moves in the index.
What this essentially means is that when the VIX rallies incredibly strongly, the front contracts tend to mimic a good degree of the movement, but still lag somewhat, as seen by backwardation remaining in the 10-15% range. However, when the VIX rallies strongly, it tends to leave contracts like M4 and M7 in the dust in that while the VIX is strong, M4 to M7 are in the vicinity of 40-60% under the spot level of the VIX.
This may seem like a bit of a rabbit trail but it’s important to understand and note, because this essentially means that the underlying returns of VIXM are going to be only loosely correlated with the changes of the VIX as compared to short-term indices. The trade-off is basically this: with VIXM you get fewer losses from roll yield, but you track the changes in the VIX to a much lesser degree.
Ultimately, VIXM still is losing from roll yield over long time periods, and it is doing so at an annualized rate of 20%. For this reason, I suggest taking profits on your open VIXM positions to avoid the reversion to the mean as the VIX continues to normalize and roll yield ultimately takes a toll on shares once again.
Conclusion
VIXM has had a strong year due to the historic rally in the VIX. VIXM tracks the Mid-Term VIX Futures Index, which allows it to reduce roll yield at the cost of diminished correlation to the VIX. VIXM’s methodology declines at an annualized rate of 20%, which means that the recent rally is likely to be erased in the coming months.
Disclosure: I/we have no positions in any stocks mentioned, and no plans to initiate any positions within the next 72 hours. I wrote this article myself, and it expresses my own opinions. I am not receiving compensation for it (other than from Seeking Alpha). I have no business relationship with any company whose stock is mentioned in this article.