Southwestern Energy: Bullish On Gas Prices, But Clarity On 2021 Hedges Needed
by QuandaryFXSummary
- The natural gas markets are poised to rally substantially, as production is declining, while the summer is expected to be abnormally warm.
- SWN follows a rolling three-year dynamic hedging program and has indicated that it is bullish natural gas.
- I am bullish SWN due to the rise in natural gas, but investors need more clarity as regards its 2021 hedging plans.
Over the past year, holders of the Southwestern Energy Company (SWN) have benefited, with shares climbing by nearly 40% compared to the overall decline seen in the S&P 500.
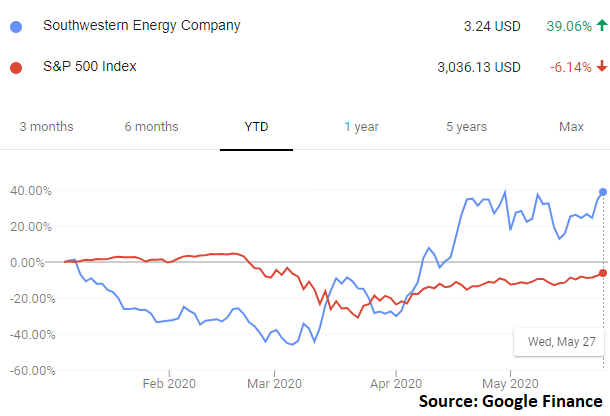
While these returns have been strong and some might be tempted to call a top, I believe that more upside remains. Specifically, I believe that both natural gas fundamentals as well as SWN’s positioning have the company poised to see further rallies throughout this year.
Natural Gas Markets
Let’s start this piece off with an analysis of the natural gas markets. Put simply, it has been a hard year for natural gas producers, as the outright prices of gas have dropped across the board.
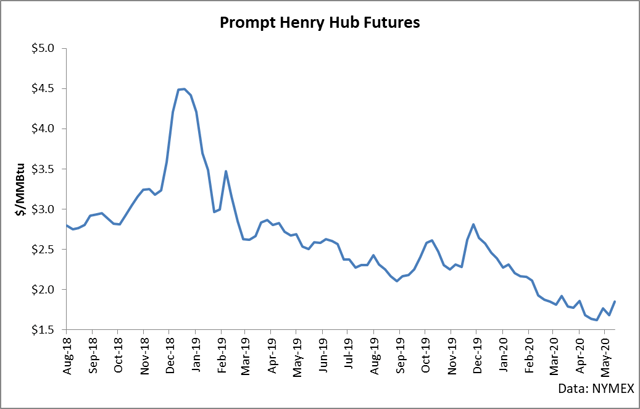
While these declines have certainly been significant and damaging to a number of producers, I believe that we are current sitting at the cusp of a major seasonal switch. What I mean by this is that over the coming months, I believe that gas fundamentals will strongly swing into the bullish territory from the current bearish state.
To get an idea as per how bearish this year has been, here is the weekly change in natural gas inventories compared to the 5-year average as well as 2019 figures throughout the year.
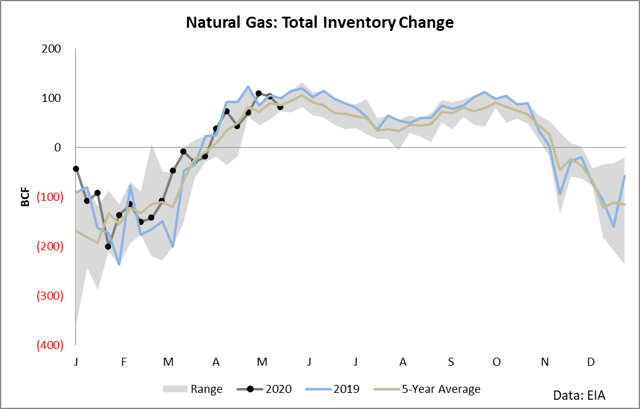
What the above chart shows is that in most weeks of this year, natural gas inventories have either been at or above the 5-year average, with a few weeks seeing figures greater than the 5-year range.
There are three basic drivers here which are weighing down on the balance and leading to these bearish figures. The first driver is that we had a mild winter, which resulted in weak consumer demand for heating.
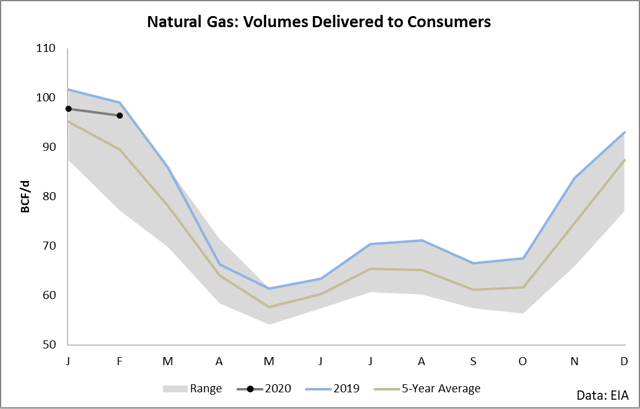
Natural gas has very clear seasonal demand patterns, and heating during the winter season takes up the largest share of its demand. When you have a poor winter season, it essentially means that the largest form of demand doesn’t “show up” so to speak, and prices tend to drop as a result. For example, when poor demand revealed itself during the early months of this year, gas prices fell off a cliff by dropping over 20%.
The second key bearish variable this year has been the impact from the coronavirus. We don’t have authoritative data from the EIA which shows this impact yet (it’s published 2-3 months after the fact); however, the clear weekly pattern of rising inventories makes the case. Industrial demand for natural gas has been hit hard, as evidenced by continued above-average builds over the past few months.
And the third key bearish variable is that natural gas production has continued to climb higher, with each reported month of this year sitting above 100 BCF/day.
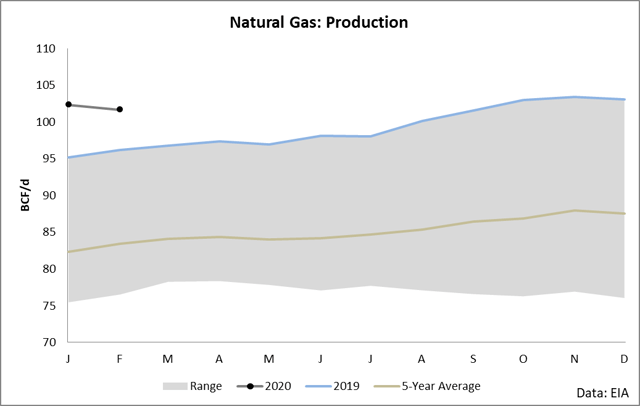
It is no secret that gas production has been climbing for several years following the start of the shale revolution, however the overall growth rate, when combined with the poor demand seen this year, has resulted in a very weak pricing environment for gas.
This, however, is where we take a turn in our analysis and pivot towards the emerging bullishness in the data. Commodity markets tend to move in cycles in that periods of bearishness lead to periods of bullishness. For example, the past few months of bearish prices and fundamentals have basically resulted in a very strong collapse in the natural gas rig count.
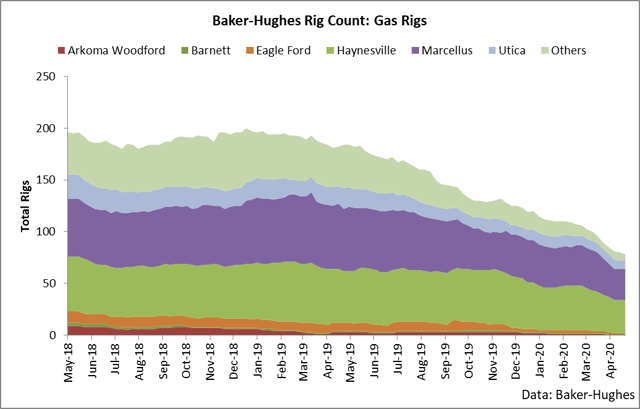
Historically speaking, when the rig count collapses, it does so until we see a sustained recovery in natural gas prices. For example, look at the 2015-2016 time period in the chart below.
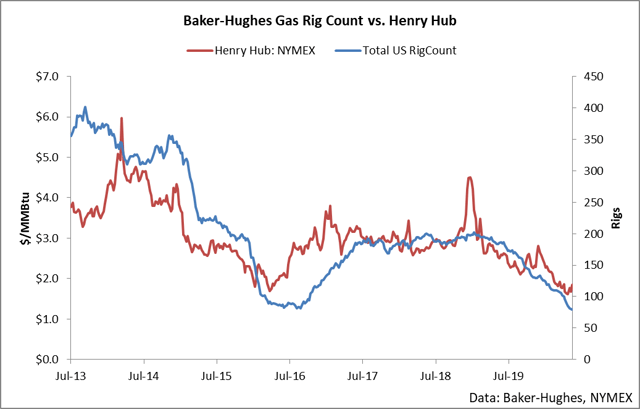
As you can see, strong accelerations in the drop in natural gas rigs tends to be followed by rising prices. The EIA has spotted this trend in its latest Short-Term Energy Outlook, and it is currently calling for production to drop by over 10% throughout the end of the year.
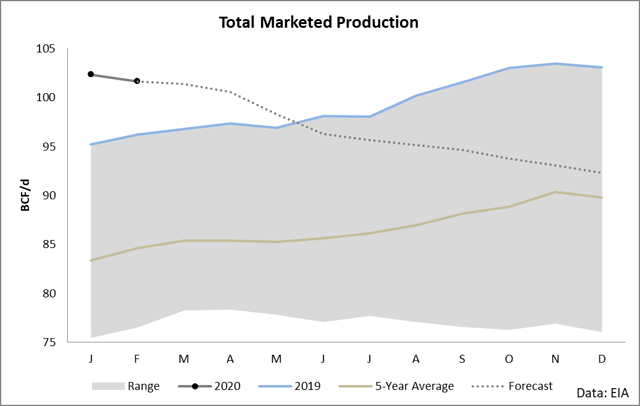
All else equal, dropping production is bullish a commodity in that supply is sapped. However, when this is combined with NOAA’s seasonal forecast for a very hot summer, the case becomes more bullish.
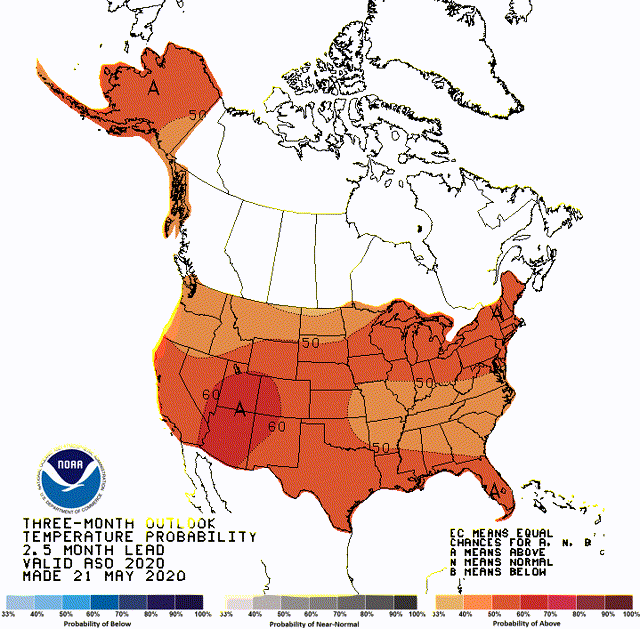
This is likely self-explanatory to many followers of natural gas, but cooling demand is the largest driver of natural gas demand change during the summer, so a hot summer basically equates to more demand for electric generation.
When you combine the fact that production is dropping and the summer is likely to be hot, the case for a bullish natural gas market is pretty clear. To get an idea as to the magnitude of the change which may come to the price of natural gas, I have examined the changes in natural gas seen in the year following a certain level of inventory changes.
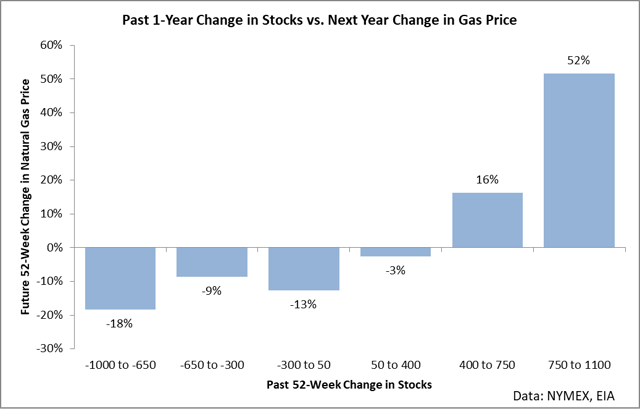
The above chart captures a lot of information in one graphic, so let’s walk through it. Basically, what I have done in this chart is first off, go back and figure out the year-over-year change in natural gas inventories for any given week. Then, I calculate out what happened to the price of natural gas over the next year given a certain rise in inventories.
The basic idea behind this chart is that it captures the cyclical pattern of supply and demand at work within natural gas. When you see stocks rally strongly, prices tend to fall and production tends to decline. This action of declining production is actually the fuel which results in the prices of natural gas rallying in the future, because supply drops while demand typically performs at seasonal levels.
Over the last few weeks, we have seen the year-over-year change in inventories in the territory of 750-890 BCF. In other words, inventories have strongly surged due to weak demand and growing production - and as noted earlier, these variables have led to a lower natural gas price this year.
What the above chart clearly shows is that when we see a very large surge in inventory, prices tend to rise strongly over the next year. The reason for this is that when gas inventories climb, production is ultimately reduced - and even assuming base seasonal demand, inventories will fall, all else equal. As inventories fall, prices tend to rise.
This historical analysis suggests that we will likely see natural gas rise by around 52% over the next year. This may seem like a very large figure, but for a comparison, the EIA is calling for an 85% increase in spot gas prices by year end in its STEO. Since SWN is a large producer of natural gas and its primary revenues come from natural gas, this is a clear Buy signal for the stock. Since the price of its commodity is likely going to be rising, its share price is likely to rise as well. But let’s dig into the nuances of SWN to see how it is positioned to capture this growth in the price of gas.
Southwestern Energy
This graphic is a little dated, but it essentially shows the core activities and locations of SWN’s production.
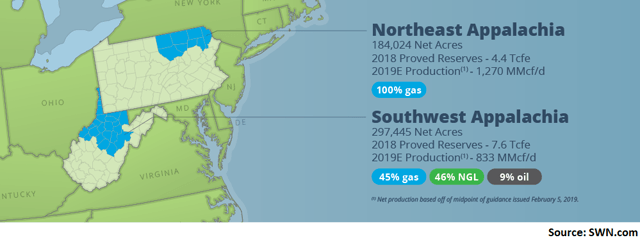
As you can see, for the most part SWN produces natural gas, while it does receive revenues from both NGL production and oil. This said, however, simple math shows that the lion’s share of revenues is coming from the natural gas offtake across the Appalachia.
The market generally prices this into the shares of SWN in that there is a loose, but present, correlation between changes in the price of natural gas and the company share price.
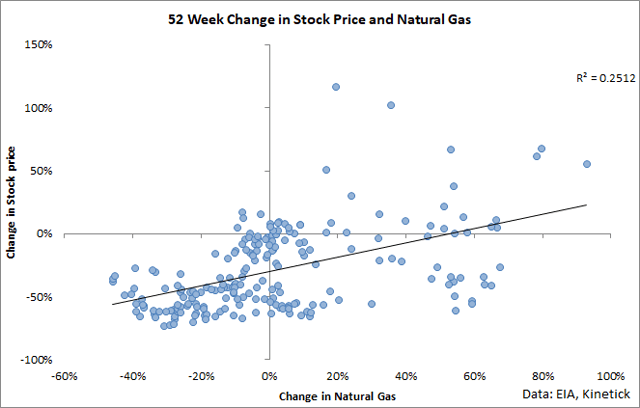
When I invest in a commodity producer, the first thing I want to know is to what degree will the cash flows received by the company track the underlying price changes of the commodity. The reason why it is important to monitor this information is that when you hold a natural gas producer, you need to know if an increase in the price of natural gas will correlate with an increase in share price.
In the case of SWN, I have been studying its hedging strategy and I am slightly concerned that it may not be able to capture the full upside of the coming move in natural gas. For example, its 10-K, the company indicates that it is largely hedged through 2020.
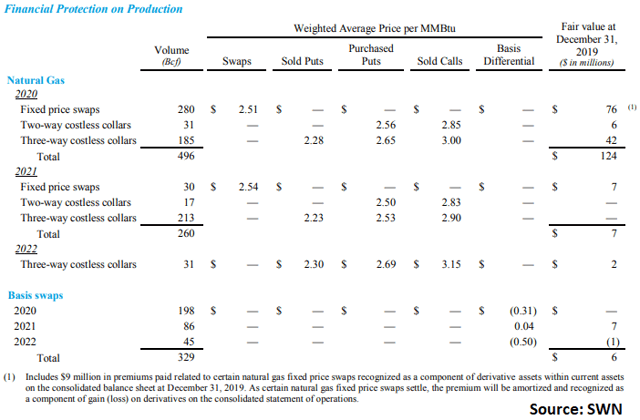
At the start of the year, this strategy has been very effective in that in the first-quarter gas prices declined strongly and SWN realized $93 million cash-settled hedge gains with 87% of production hedged for the year.
SWN follows a three-year rolling hedge program in which in a given year it is working on establishing hedges for the next three years of production. The company hedges its major commodity exposure across natural gas, NGLs, and oil production. It also hedges its basis risk in that NYMEX Henry Hub is priced in Louisiana, while its production is primarily in the Appalachia.
This hedging program is effective in that it protects during price declines - as evidenced by the first quarter of this year, but I believe it potentially is going to blunt a good degree of the potential gains seen throughout the rest of this year. For example, while its hedges are currently economic, the company's three-year strategy has it rolling into 2021 hedges throughout this year.
My basic forecast is calling for natural gas prices to rally between now and the middle of the next year. And the EIA is calling for an 85% rally between now and the end of the year. In its latest earnings call, SWN indicated that it has a bullish view on natural gas prices, but did not provide commentary as per the precise timing of when hedges will be placed for 2021.
This is understandable in that if the market knew the timing of the hedges, traders would front-run positions and likely impact prices and ultimately disadvantage SWN. However, before I can give a “strongly bullish” recommendation on SWN, I need to know from an investing standpoint that the bullish view on natural gas markets translates into delayed hedges. For example, if SWN aggressively hedges at today’s prices for 2021, it is potentially missing out on 85% of the upside (if the EIA is right and the forward curve adjusts in proportion to this move) as compared to delaying its hedging into later in the year.
In its next earnings call, I will be looking for more clarity around how SWN plans to act on its bullish forecast for natural gas in that the timing of its hedges will have a massive impact on the cash flows of the company. If it aggressively hedges before the price of gas (and the curve) moves up, I will still be bullish, but will recommend other gas producers as the best alternative. However, if the company indicates that it is delaying hedges to capture further upside, I will be strongly bullish.
Conclusion
The natural gas markets are poised to rally substantially, as production is declining, while the summer is expected to be abnormally warm. SWN follows a rolling three-year dynamic hedging program and has indicated that it is bullish natural gas. I am bullish SWN due to the rise in natural gas, but investors need more clarity as regards its 2021 hedging plans.
Disclosure: I/we have no positions in any stocks mentioned, and no plans to initiate any positions within the next 72 hours. I wrote this article myself, and it expresses my own opinions. I am not receiving compensation for it (other than from Seeking Alpha). I have no business relationship with any company whose stock is mentioned in this article.