AUD/USD Price Analysis: Greenback’s drop accelerates the rise above 0.6600
by Anil Panchal- AUD/USD carries the previous day’s recovery gains to attack 0.6650.
- US dollar index (DXY) refreshes two-month low under 98.50.
- Two-day-old symmetrical triangle questions immediate upside.
- 200-HMA adds to the support below the triangle’s lower line.
AUD/USD takes the bids around 0.6658, up 0.20% on a day, during the pre-European session on Friday.
The Aussie pair recently gained traction after the US dollar index (DXY), a gauge of the greenback versus the major currencies, slipped to the fresh low since March 30 to 98.25.
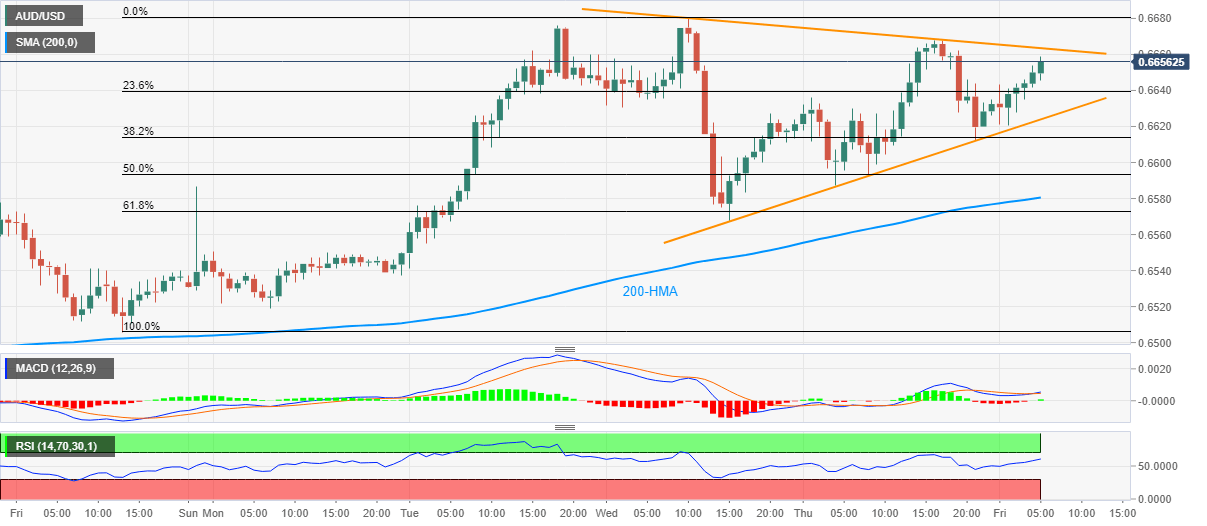
Even so, the quote stays inside the immediate triangle formation between 0.6665 resistance and 0.6625 support.
As the bullish MACD favors the pair’s run-up past-0.6665, it’s wise to expect a further rise towards 0.6700 afterward.
Alternatively, a downside break below 0.6625 might have to take a rest on a 200-HMA level of 0.6580.
AUD/USD hourly chart

Trend: Sideways to positive
Additional important levels
| Overview | |
|---|---|
| Today last price | 0.665 |
| Today Daily Change | 13 pips |
| Today Daily Change % | 0.20% |
| Today daily open | 0.6637 |
| Trends | |
|---|---|
| Daily SMA20 | 0.651 |
| Daily SMA50 | 0.6343 |
| Daily SMA100 | 0.6484 |
| Daily SMA200 | 0.6658 |
| Levels | |
|---|---|
| Previous Daily High | 0.6668 |
| Previous Daily Low | 0.6587 |
| Previous Weekly High | 0.6617 |
| Previous Weekly Low | 0.641 |
| Previous Monthly High | 0.657 |
| Previous Monthly Low | 0.598 |
| Daily Fibonacci 38.2% | 0.6637 |
| Daily Fibonacci 61.8% | 0.6618 |
| Daily Pivot Point S1 | 0.6593 |
| Daily Pivot Point S2 | 0.655 |
| Daily Pivot Point S3 | 0.6513 |
| Daily Pivot Point R1 | 0.6674 |
| Daily Pivot Point R2 | 0.6711 |
| Daily Pivot Point R3 | 0.6754 |