EOG Resources: The Three Wise Monkeys
by Fun TradingSummary
- Revenues were $4.72 billion, up from $4.06 billion in the same quarter the previous year.
- Total production was a record of 874.1K Boep/d, up 13% from last year, and up 2.8% sequentially. 95.4% of the total output comes from the US.
- The best way is to keep a low core investment for the long term and trade short term a large part of your position to take advantage of the volatility.
Image: EOG Office. Houston Chronicle.
Investment Thesis
Houston-based EOG Resources (EOG) released its first-quarter results on May 8, 2020. It is hard to criticize this company because I think management did the right thing and has shown an excellent job of producing oil and gas in the US shale so efficiently. In some other circumstances, I would have praised the management and congratulated the company's achievement. Another record production is ringing the bell, great.
However, it is not the way the oil world is working. You can't pump indefinitely and keep increasing oil and gas production and ignoring egoistically what severe consequences this mindset might create. EOG Resources is part of the problem, not part of the solution. Worse, what is happening is not changing the issue at all, and we will see some quick upsides and more downsides for many months and years to come. The oil world will never learn.
The investment thesis is not a very favorable one when it comes to a "robust" US Shale player like EOG Resources. We can't play the three wise monkeys (Mizaru, Kikazaru, and Iwazaru) forever and ignore what is going on.
At the end of the day, it is your common sense that should prevail and the catastrophic deterioration of the world economy that will win the tournament, whether we like it or not. Then, better profit from what is coming and avoid being a victim.
I do not say EOG Resources is about to disappear, but I see that dark clouds and fierce headwinds are coming, and common shareholders should be preparing for it.
The best way is to keep a low core investment for the long term and trade short term a large part of your position to take advantage of the volatility that will increase, as we slowly learn how deeply affected the oil demand has been.
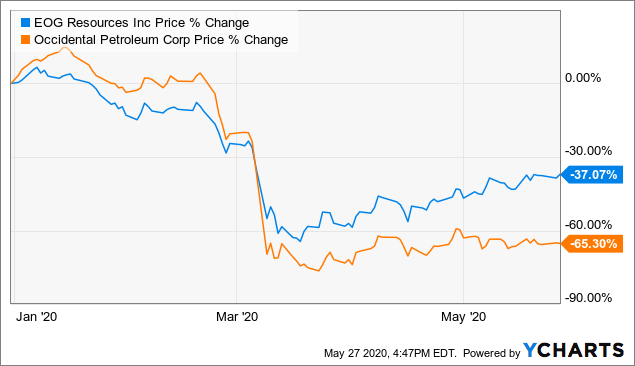
The chart below is showing a 28% differential between EOG and OXY, mostly attributable to the ill-timed Anadarko acquisition.
Data by YCharts
What makes EOG a typical business that may suffer after the double Black Swan Event?
The company is primarily producing oil and gas from the US shale or 95.4% of the total output in 1Q '20.

As we can see, production in the USA has been increasing significantly while international production slowly declined.
| Production per Region in K Boe/d | 3Q'18 | 4Q'18 | 1Q'19 | 2Q'19 | 3Q'19 | 4Q'19 | 1Q'20 |
| United States of America | 695.0 | 715.5 | 722.0 | 760.4 | 784.2 | 803.6 | 833.8 |
| Trinidad | 44.1 | 39.0 | 45.1 | 46.1 | 44.1 | 40.9 | 34.0 |
| Other International | 9.7 | 10.0 | 6.5 | 6.3 | 5.8 | 5.8 | 6.3 |
| TOTAL | 748.8 | 764.5 | 773.6 | 812.8 | 834.2 | 850.3 | 874.1 |
Bill Thomas, the CEO, said on the conference call:
EOG is a resilient company. And we believe the severity of this process will demonstrate just how resilient we are. The COVID-19 pandemic compounded what started as an oil price war, which drove oil prices to levels we have not seen in more than 20 years.
EOG Resources - 1Q '20 Balance Sheet: The Raw Numbers
| EOG Resources | 1Q'19 | 2Q'19 | 3Q'19 | 4Q'19 | 1Q'20 |
| Total Revenues and others in $ Billion | 4.059 | 4.698 | 4.303 | 4,320 | 4,718 |
| Net income in $ Million | 635 | 848 | 615 | 637 | 10 |
| EBITDA $ Million | 1,762 | 2,097 | 1,791 | 1,831 | 1,076 |
| EPS diluted in $/share | 1.10 | 1.46 | 1.06 | 1.10 | 0.02 |
| cash from operating activities in $ Million | 1,608 | 2,687 | 2,062 | 1,807 | 2,585 |
| Capital Expenditure in $ Million | 2,000 | 1,563 | 1,491 | 1,368 | 1,689 |
| Free Cash Flow in $ Million | -392.7 | 1,123.6 | 570.8 | 438.9 | 896.1 |
| Total cash $ Billion | 1.14 | 1.16 | 1.58 | 2.03 | 2.91 |
| Long-term debt in $ Billion | 6.08 | 5.18 | 5.18 | 5.18 | 5.22 |
| Dividend per share in $ | 0.2875 | 0.2875 | 0.2875 | 0.375 | 0.375 |
| Shares outstanding (diluted) in Million | 580.2 | 580.2 | 581.3 | 579.5 | 580.3 |
Source: EOG Resources and Morningstar
Note: Historical data since 2015 are available only for subscribers.
Analysis: Revenues, Earnings Details, Net Debt, Free Cash Flow, And Upstream Production
1 - Total Revenues and others were $4.72 billion in 1Q '20
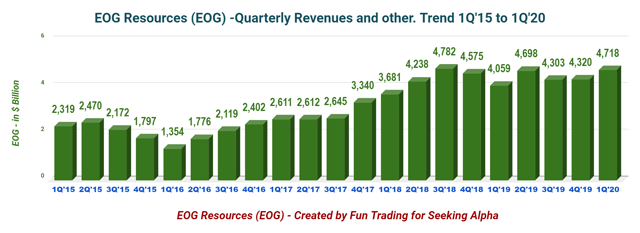
EOG Resources delivered a "mixed" 1Q '20 results with adjusted net income per share of $0.55, well below the profit of $1.19 realized the same quarter last year. Revenues were $4.72 billion, up from $4.06 billion in the same quarter the previous year.
2 - Free cash flow was $896.1 million for the 1Q'20
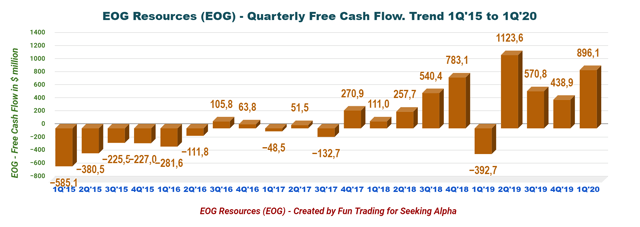
Note: The organic free cash flow is the cash from operating activities minus CapEx.
The free cash flow for the first quarter of 2020 was a gain of $896.1 million, and a whopping $3.03 billion annually ("ttm").
The yearly dividend is now $1.50 per share yearly or a yield of 2.84%. I was expecting a suspension for the next few quarters of 2020, but it did not happen.
Tim Driggers, the CFO, said in the conference call:
The second reason we're confident that EOG will weather the severe downturn is our premium drilling strategy. We believe it's the most strict investment hurdle rate in the industry. Premium requires that all investments earn a 30% direct after-tax rate of return using an oil price of $40 flat. We initiated our premium strategy in 2016 during the last downturn.
3 - Oil-equivalent production and other
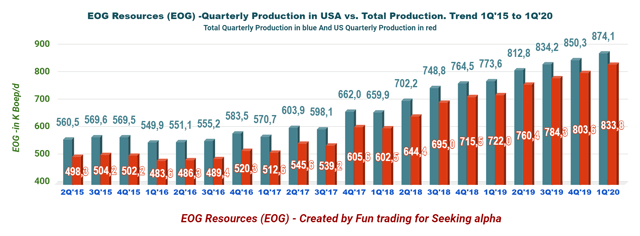
EOG Resources' oil production surpassed expectations during the first quarter. Total production was a record of 874.1K Boep/d, up 13% from last year, and up 2.8% sequentially. 95.4% of the total output comes from the US, as you can see in the chart below. EOG relies heavily on crude oil, which represents 55.3% of the total production.
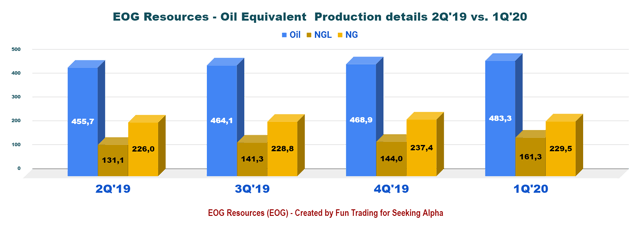
The price of oil (composite) realized by the company this quarter was $46.96 a barrel, down 16.3% from a year ago and down 17.8% sequentially.
Total costs per Boe in 1Q'20 was $26.15, down from $27.60 per Boe the preceding quarter.

Note: EOG Resources is receiving a premium for its oil and condensate versus peers of $2.22 per barrel in 1Q '20 above the WTI, which is significant. The primary production regions were the company's wells in the Delaware Basin and South Texas Eagle Ford in 1Q '20.
Hedging position: As of May 5, EOG Resources hedged 301K Bop/d of oil at $48.30 per barrel for 2Q and 186K Bop/d of oil at $46.78 for the 3Q.
4 - Net debt and cash
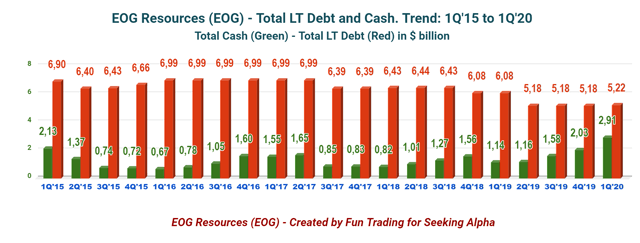
Net debt is now $2.31 billion, and the net debt-to-capitalization is 10% from 13% in 4Q'19. EOG presents a perfect debt profile that will certainly help in the next following quarters.
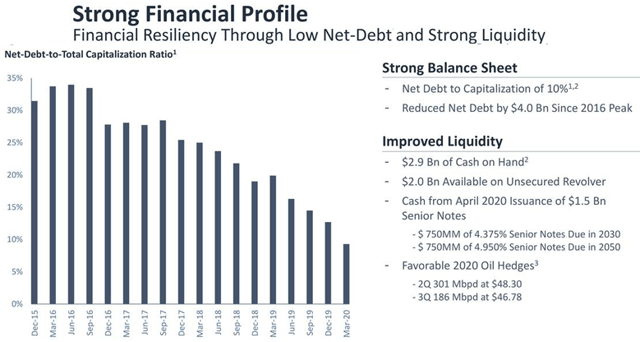
Source: From the presentation.
5 - EOG 1Q' 20 and full-year 2020 Production/CapEx Guidance
- EOG Resources anticipates its 2020 average daily production to be between 671.4K and 739.6K Boep/d, 23% lower than its earlier projection.
- The company also reduced its budget for the 2020 CapEx to $3.3-3.7 billion from $4.3-4.7 billion initially.
Conclusion And Technical analysis
EOG Resources is a great shale producer, and the first quarter is another statement of excellence. Production has reached another record, but this excellence is coming at a price. So far, EOG Resources is showing a great balance sheet, but the countdown has begun.
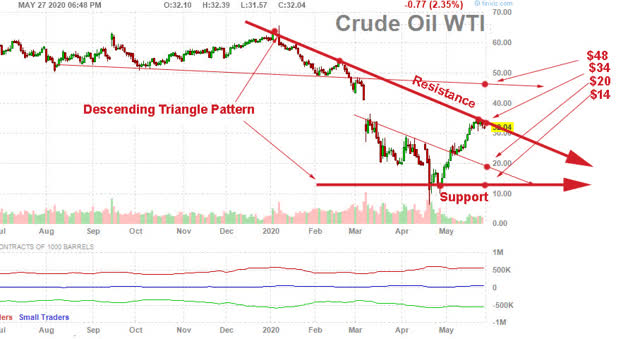
Demand is plummeting, and oil prices are now merely a shadow of what they were a few months ago. I think oil prices are more likely to go down right now after a good run-up. WTI price has reached resistance and is expected to go down now in the range between $25 and $14.
I see only a remote chance for a resistance breakout and a retest of $48, but it is a slight possibility that it should not be disregarded.
Technical Analysis (short term)
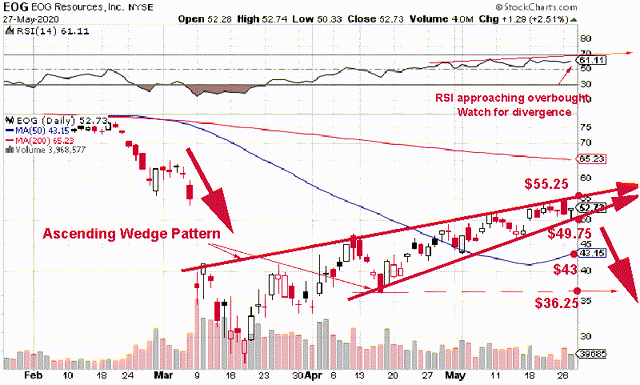
EOG is forming an ascending wedge pattern with resistance at $55.25 and support at $49.75. The formation has been entered on the resistance side and is likely to break out on the support side.
The next support is the 50MA at around $43, which is a possible buy and accumulation level. However, depending on the oil prices, we may eventually reach $36.25, where I will be more confident to buy for the mid-term.
Author's note: If you find value in this article and would like to encourage such continued efforts, please click the "Like" button below as a vote of support. Thanks!

Join my "Gold and Oil Corner" today, and discuss ideas and strategies freely in my private chat room. Click here to subscribe now.
You will have access to 57+ stocks at your fingertips with my exclusive Fun Trading's stock tracker. Do not be alone and enjoy an honest exchange with a veteran trader with more than thirty years of experience.
"It's not only moving that creates new starting points. Sometimes all it takes is a subtle shift in perspective," Kristin Armstrong.
Fun Trading has been writing since 2014, and you will have total access to his 1,865 articles and counting.
Disclosure: I/we have no positions in any stocks mentioned, and no plans to initiate any positions within the next 72 hours. I wrote this article myself, and it expresses my own opinions. I am not receiving compensation for it (other than from Seeking Alpha). I have no business relationship with any company whose stock is mentioned in this article.