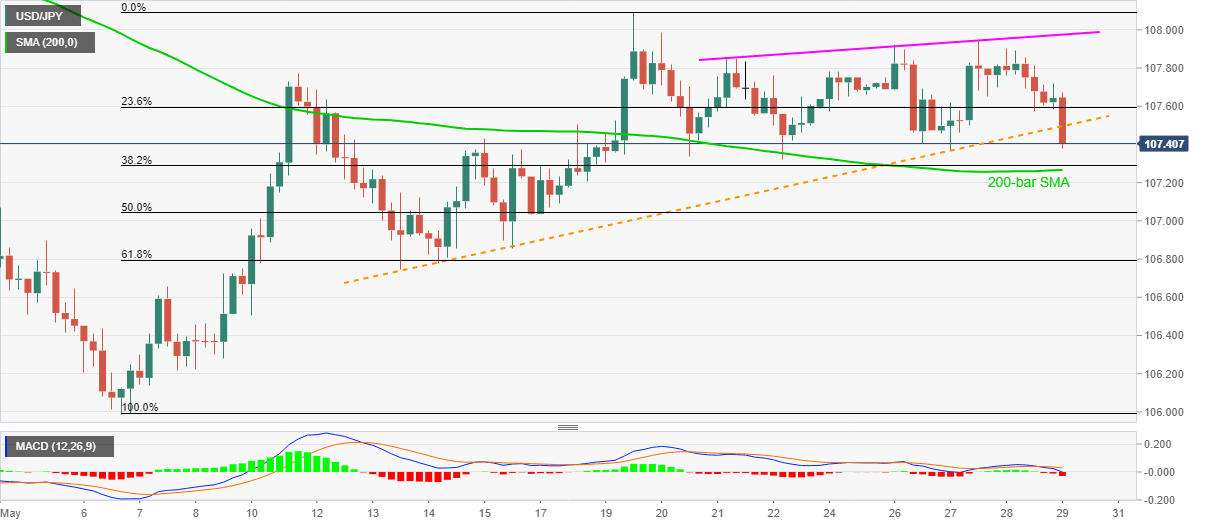
USD/JPY Price Analysis: Breaks 12-day-old supportline as risk aversion intensifies
by Anil Panchal- USD/JPY extends pullback from 107.95 to probe weekly low.
- Headlines from China, Hong Kong strengthens the early-Asian risk-off sentiment.
- Bearish MACD, trade dears signal further declines, 200-bar SMA offers immediate support.
- Weekly ascending trend line could challenge buyers beyond the support-turned-resistance.
USD/JPY takes the offers around 107.38, down 0.24% on a day, amid the early Friday’s trading. The risk barometer recently broke an upward sloping trend line from May 13 as headlines from China and Hong Kong exert additional downside pressure on the market’s risk-tone.
While China increases hardships for Australia, Hong Kong reacts to the US removing its special trading status. This adds to the market’s earlier worries after US President Donald Trump called for China conference.
Other than the risks, the bearish MACD signals and a sustained break of the short-term key support line, now resistance, also favors the sellers.
As a result, the quote could drop towards a 200-bar SMA level of 107.27 during further downside. However, 50% and 61.8% Fibonacci retracements of the pair’s early-month upside, respectively around 107.00 and 106.80, could challenge the bears then after.
Meanwhile, pullback moves beyond the short-term support-turned-resistance line, at 107.50, could push the quote towards a rising trend line from May 21, currently near 108.00.
It should also be noted that the multiple upside barriers surrounding 108.05/10, comprising the tops marked since late-April might keep the bulls checked after 108.00.
USD/JPY four-hour chart

Trend: Bearish
Additional important levels
| Overview | |
|---|---|
| Today last price | 107.4 |
| Today Daily Change | -0.25 |
| Today Daily Change % | -0.23% |
| Today daily open | 107.65 |
| Trends | |
|---|---|
| Daily SMA20 | 107.19 |
| Daily SMA50 | 107.86 |
| Daily SMA100 | 108.38 |
| Daily SMA200 | 108.34 |
| Levels | |
|---|---|
| Previous Daily High | 107.9 |
| Previous Daily Low | 107.57 |
| Previous Weekly High | 108.09 |
| Previous Weekly Low | 107.04 |
| Previous Monthly High | 109.38 |
| Previous Monthly Low | 106.36 |
| Daily Fibonacci 38.2% | 107.7 |
| Daily Fibonacci 61.8% | 107.77 |
| Daily Pivot Point S1 | 107.51 |
| Daily Pivot Point S2 | 107.38 |
| Daily Pivot Point S3 | 107.18 |
| Daily Pivot Point R1 | 107.84 |
| Daily Pivot Point R2 | 108.04 |
| Daily Pivot Point R3 | 108.17 |