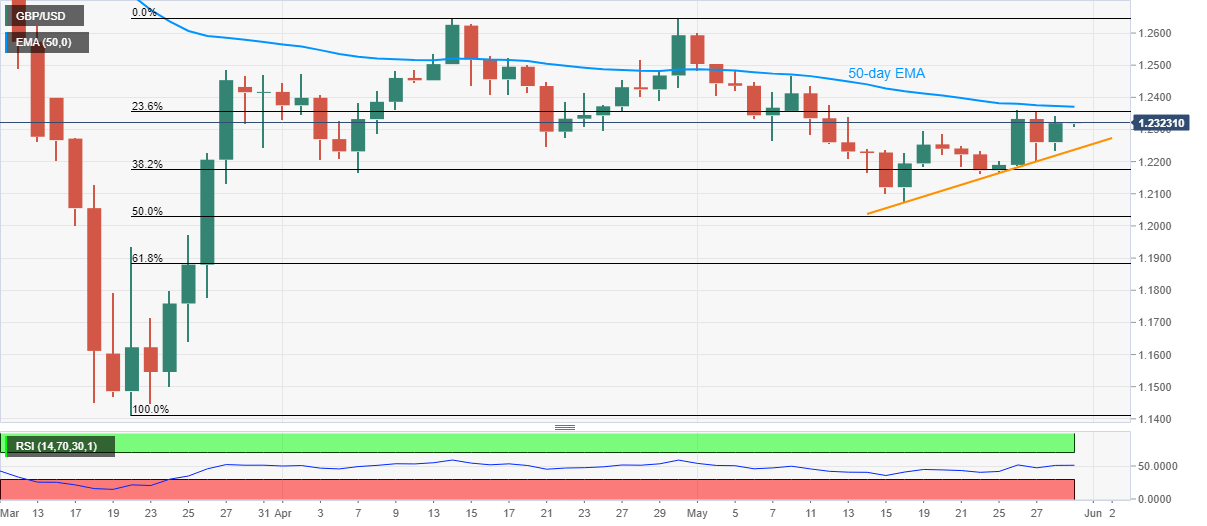
GBP/USD Price Analysis: 50-day EMA regains bulls’ attention above 1.2300
by Anil Panchal- GBP/USD bounces off intraday low of 1.2308, extends the previous day’s recovery.
- 50-day EMA has been restricting the upside for the last 19 days.
- Short-term rising trend line keeps the bulls hopeful above 1.2240/35.
The GBP/USD pair’s pullback from the intraday bottom fades upside momentum around 1.2320/25 amid Friday’s Asian session. Even so, the pair stays mildly positive for the second day in a row.
While looking at the upward sloping trend line from May 18 and the RSI levels, the Cable is again likely to confront the 50-day EMA level of 1.2370. However, it’s further upside needs validation from May 08 high surrounding 1.2470.
Alternatively, a daily close below the immediate support line, at 1.2235 now, might recall Friday’s low around 1.2160 ahead of targeting the monthly bottom near 1.2075.
In a case where the GBP/USD prices decline below 1.2075, 1.2000 round-figure might entertain the bears before highlighting 61.8% Fibonacci retracement level of March-April upside, at 1.1883.
GBP/USD daily chart

Trend: Further upside likely
Additional important levels
| Overview | |
|---|---|
| Today last price | 1.2322 |
| Today Daily Change | 2 pips |
| Today Daily Change % | 0.02% |
| Today daily open | 1.232 |
| Trends | |
|---|---|
| Daily SMA20 | 1.2293 |
| Daily SMA50 | 1.2307 |
| Daily SMA100 | 1.259 |
| Daily SMA200 | 1.2668 |
| Levels | |
|---|---|
| Previous Daily High | 1.2345 |
| Previous Daily Low | 1.2234 |
| Previous Weekly High | 1.2296 |
| Previous Weekly Low | 1.2076 |
| Previous Monthly High | 1.2648 |
| Previous Monthly Low | 1.2165 |
| Daily Fibonacci 38.2% | 1.2302 |
| Daily Fibonacci 61.8% | 1.2276 |
| Daily Pivot Point S1 | 1.2254 |
| Daily Pivot Point S2 | 1.2189 |
| Daily Pivot Point S3 | 1.2143 |
| Daily Pivot Point R1 | 1.2365 |
| Daily Pivot Point R2 | 1.241 |
| Daily Pivot Point R3 | 1.2476 |