Gold - Patience Is A Virtue
Since mid of March at the panic lows and prices around US$1,450 Gold posted a massive rally reaching US$1,765 just 10 days ago. Anybody who missed this rally might now be under stress since governments and central bankers are doing everything to destroy the purchasing power of this hard-earned currency which is sitting in the bank account paying no interest. Gold has done a good job to protect its holders. However, blindly chasing any asset that is in an uptrend is not a good strategy. The key is always to wait for pullbacks and dips so that one can buy low instead of high. Gold - Patience is A Virtue.
Review
Looking back, my last two Gold analyses on March 15th and April 19th were partly a little too pessimistic. Although there was indeed a brutal sell-off down to US$1,450 on March 20th, the unprecedented expansion of the money supply by almost all central banks worldwide then quickly caused gold prices to rally towards US$1,747 within the following four weeks. Since this high point on April 14th, gold prices over all have traded sideways between US$1,660 and US$1,765. Thus, there wasn’t any deep pullback!
However, gold prices haven’t run away either. On the contrary, it must be noted that despite the corona crash and liquidity flooding, gold basically has not made much progress since its first interim high at US$1,689 on 24th of February. Currently, with spot gold trading slightly below US$1,710 prices are up less than US$20 since end of February!
In Euro terms, the results do look somewhat better. Here prices have just recently reached a new seven-year high at EUR1,632 in the past trading week and have also been in a flat up-trend over the last few weeks.
All in all, the price of gold has thus been stagnant for nearly eight weeks.
Technical Analysis: Gold in US-Dollars
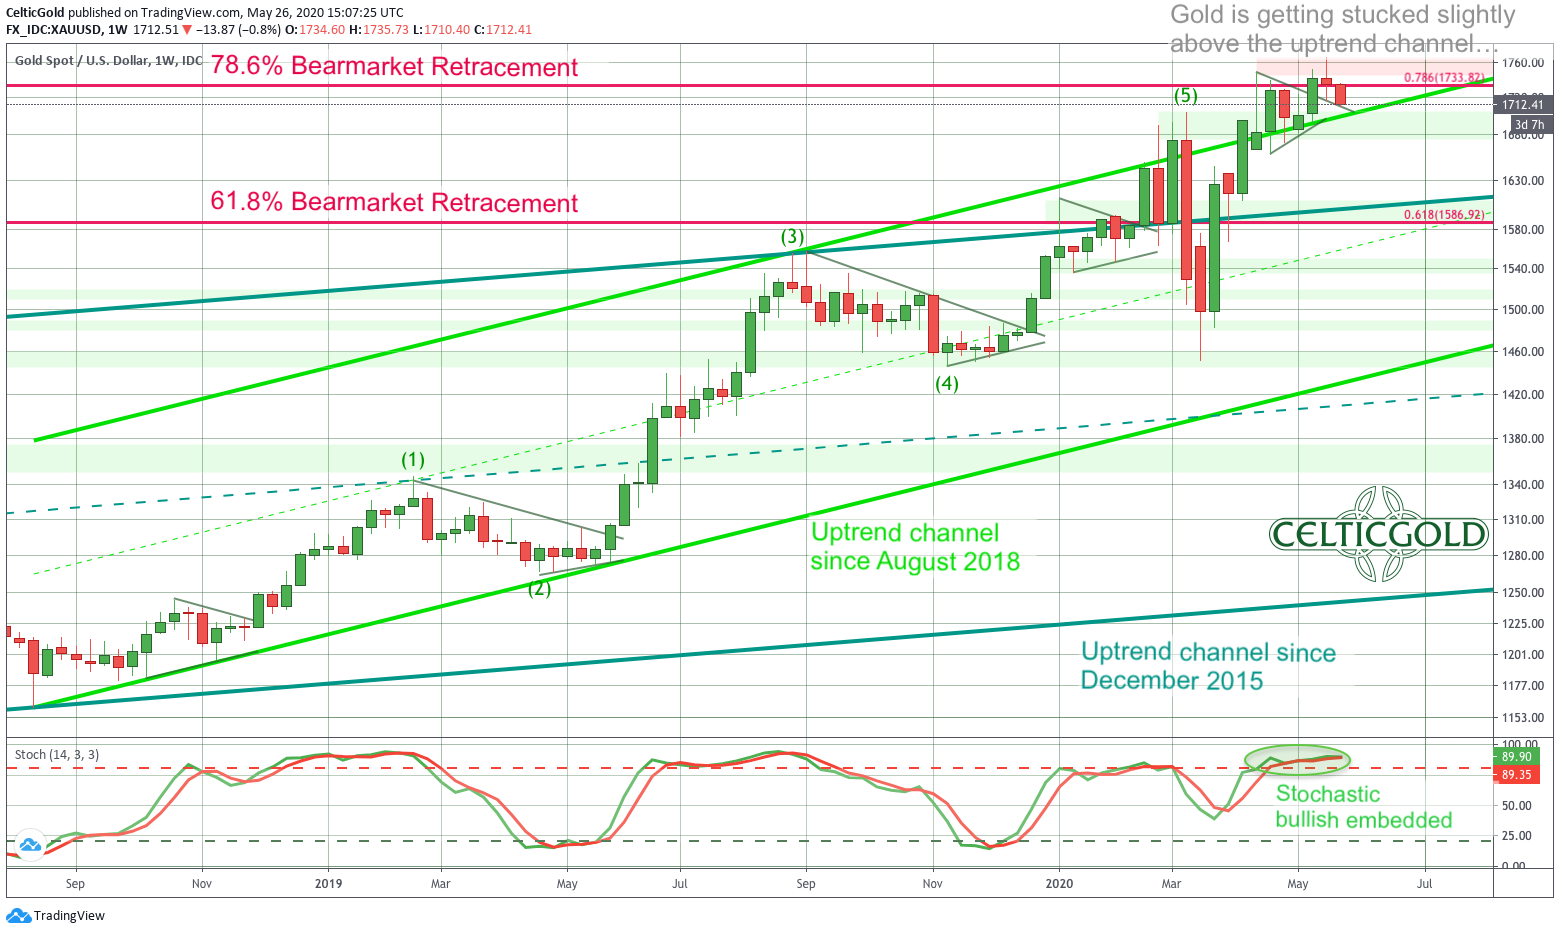
Gold in US-Dollar, weekly chart as of May 26th, 2020. Source: Tradingview
On the weekly chart, gold bulls continue to strive to finally leave the uptrend channel that began in August 2018 behind them. So far, they have not yet succeeded in doing so. Should the bulls now run out of steam or do need a breather, a quick pullback towards the mid of the trend channel would be very likely. However, despite weeks of consolidation at a high levels, there is still no sign of exhaustion. But one could speak of a “dwindling bullish momentum”.
It is noticeable that since the beginning of the year gold has been moving primarily in the zone between the 61.8% Fibonacci retracement (US$1,586) and the 78.6% Fibonacci retracement (US$1,733). These Fibonacci retracements relate to the major correction in the gold market when prices fell from US$1,920 down to US$1,045 between 2011 and 2015. Since the final low in December 2015, the bulls have now recovered 61.8% and 78.6% of the lost distance. Hence, the zone between US$1,586 and US$1,733 is the last place of refuge for the gold bears. If this last bastion can be sustainably conquered, the way to the all-time high at US$1,920 and prices above US$2,000 would be clear. From this perspective alone, the confusing back and forth over the last few weeks is therefore not surprising. At the same time the bears obviously do not (yet) have enough strength to wrest larger space from the bulls here.
However, the stochastic oscillator does not look good on the weekly chart. Both lines are still bullishly embedded above 80, but as soon as the momentum starts to turn, the strongly overbought position immediately will kick in and deliver a sell-signal. in that case a multi-weeks to multi-months corrective phase becomes extremely likely.
All in all, gold prices have been treading water for weeks now and seem to be slightly stuck above US$1,700. However, a trend reversal has not happened. Ideally, the slightly disjointed picture will dissolve with a healthy but overall manageable pullback in the summer months.
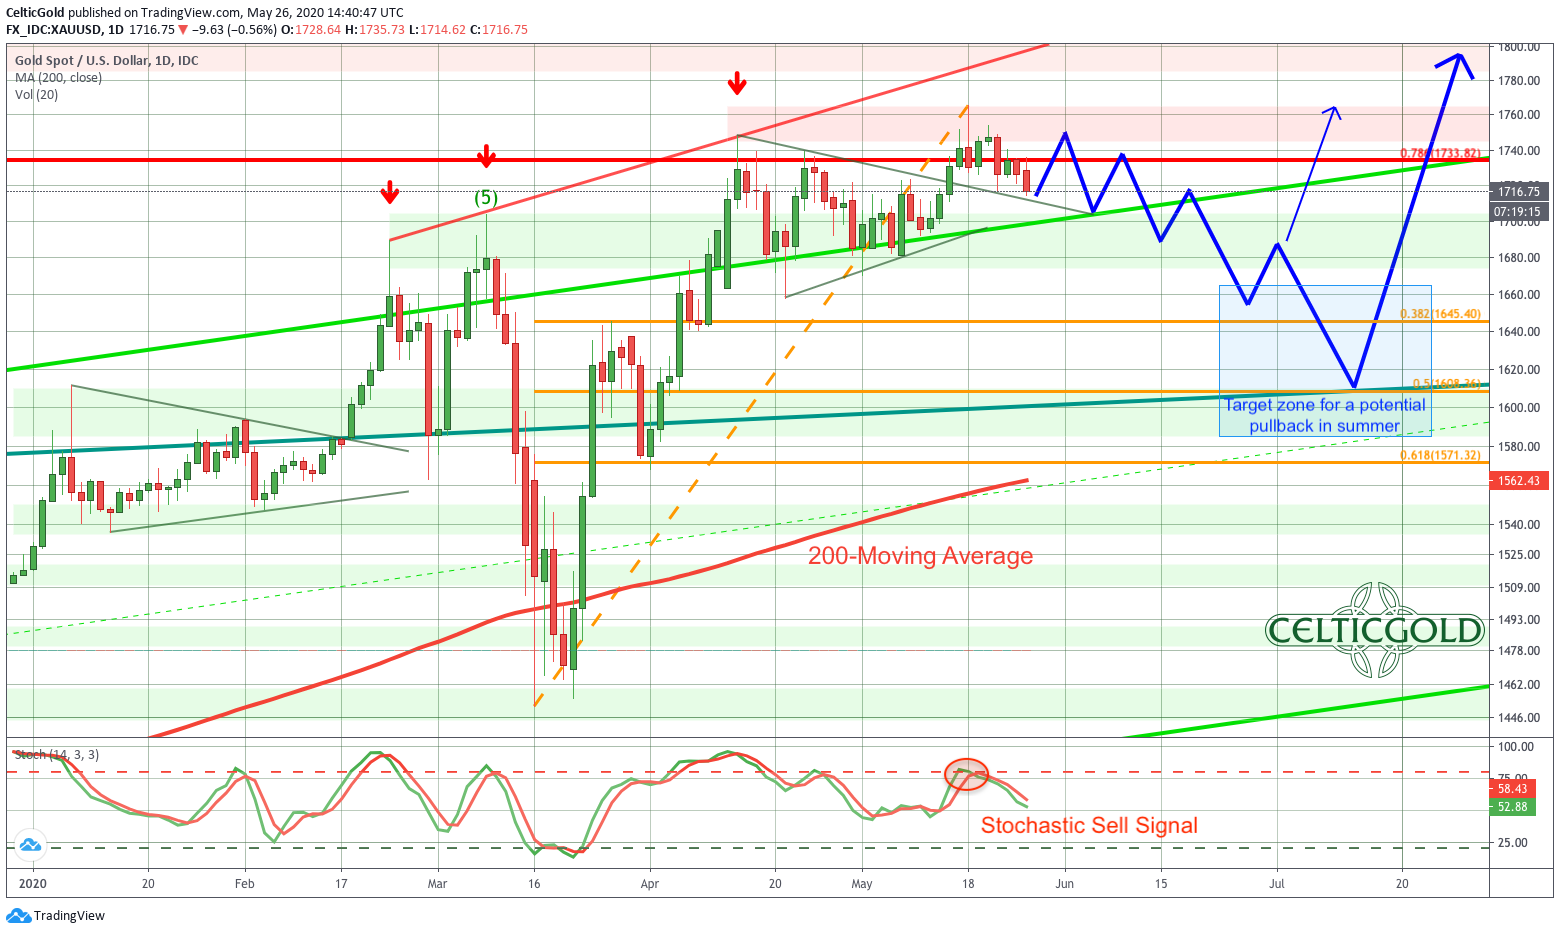
Gold in US-Dollar, daily chart as of May 26th, 2020. Source: Tradingview
On the daily chart, the bulls managed to break out of the five-week consolidation triangle on May 14. With the following spike towards US$1,765 they immediately made it clear who is in charge. In the meantime, however, this actually bullish breakout has already come to an end without any sustained gains, as prices have been falling rather rapidly from US$1,765 down to US$1,698.
Now bulls will have to answer with a bounce and a compelling recovery. However, prices above US$1,730/1,735 might already cause difficulties. Nevertheless, the chances of another wave up into the range between US$1,745 and US$1,765 are pretty good. Especially as the stochastic oscillator he has cooled down considerably on the daily chart and move in the neutral zone. This setup would once again provide enough room for another bullish run.
Furthermore, the silver price, which had just begun to move two weeks ago, does not appear to have reached the end of its rally yet. Rather, silver could pull the price of gold up again for the next few weeks.
In summary, the daily chart is neutral after weeks of consolidation. Similar to last spring and last autumn, gold prices managed to work off the heavily overbought situation without major losses but only with mild declines. Thus, at least in the short term, there is once again the chance of a rise towards the highs of US$1,765 on the chart. Even a new high at US$1,800 can not be ruled out.
Commitment of Traders: Gold
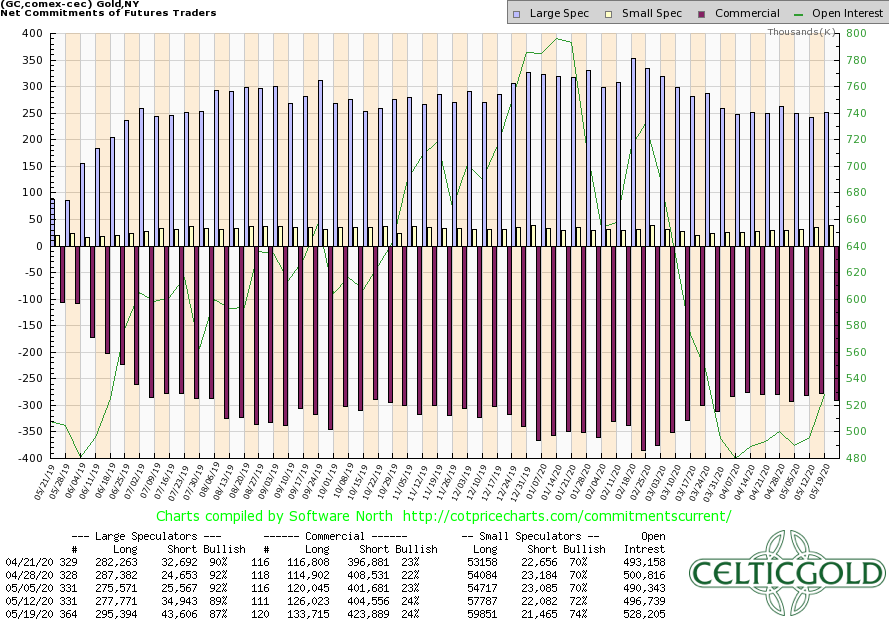
Since the breakout above the multi-year resistance zone at US$1,350/1,375 in May 2019, the situation in the gold futures market has been extremely overstretched and completely unhealthy. With the temporary crash in mid-March, the pent-up pressure was at least partially released, with commercial hedgers covering part of their exorbitantly large short position.
At the same time, however, the supply and demand shock caused by the corona crisis caused even greater difficulties for the paper jugglers on the COMEX. Short-term pullbacks of US$50 can apparently still be arranged somehow, but much lower prices below US$1,500 are not in sight. However, the commercial hedgers would need these prices to profitably cover their cumulative short position of currently 290,174 contracts.
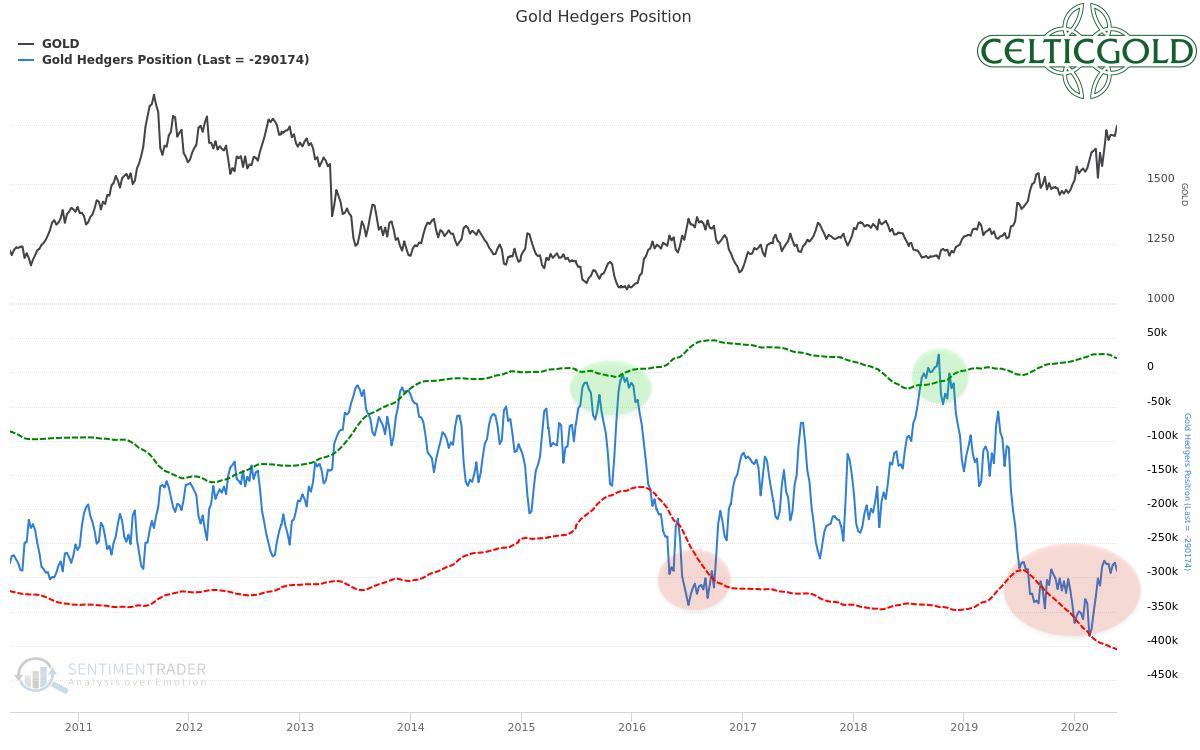
Overall the CoT-report continues to provide a clear sell-signal for the gold price. A promising contrarian bottleneck is far away and would be present at the earliest with the cumulative short position reaching levels below 100,000 contracts.
The development in the silver futures market is positive, however. Here the professional players have used the crash down to US$11.60 to cover their short position. From the CoT perspective silver should no longer be threatened by another major pullback.
Sentiment: Gold – Patience Is A Virtue
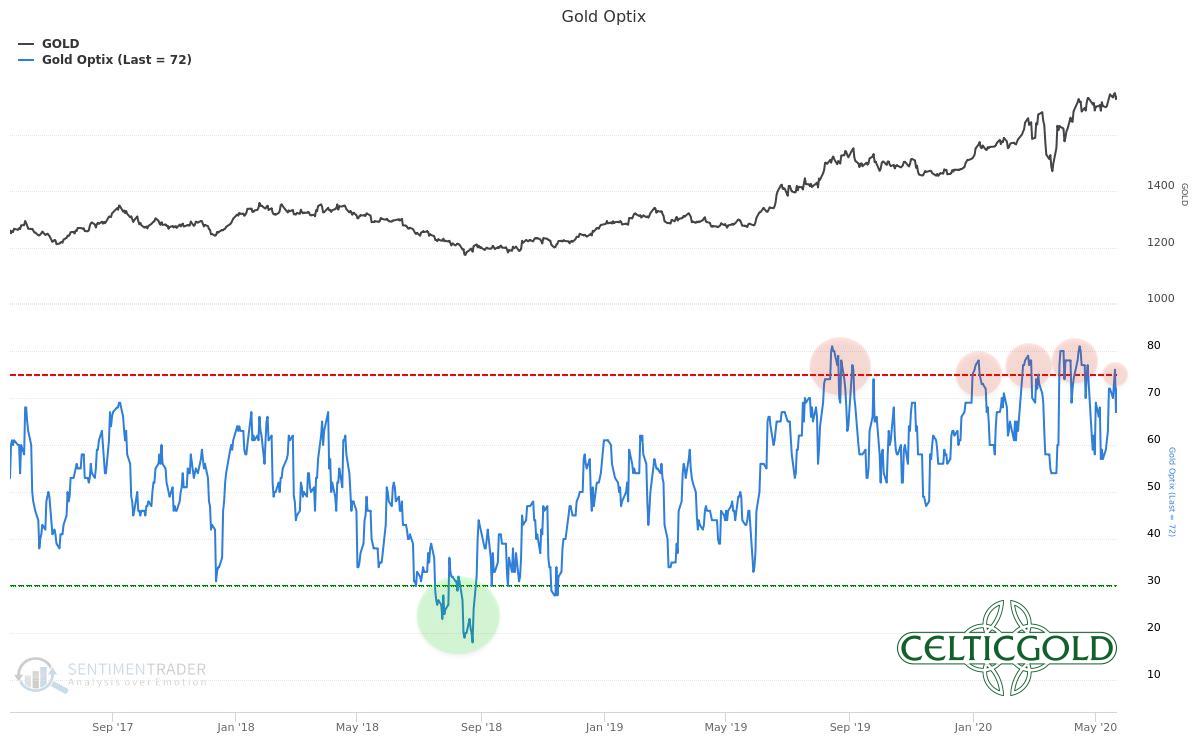
The Optix sentiment barometer for the gold price continues to provide significantly high levels of optimism among market participants. Although the pullback over the last few days has certainly caused a decrease in euphoria, the overall consensus is still clearly in favour of further rising gold prices.
Rarely, however, do markets simply move straight up. Rather, they have to use twists and turns to make sure that the masses do not fully participate in the price increases. In order to refresh the so-called “wall of worry”, a pullback towards US$1,650 or 1,600 would probably suffice.
In summary, the Gold Optix continues to urge caution. Only when mistrust and possibly even panic and fear spread at least to some extent among gold investors, will there be meaningful and contrarian entry opportunity again. Other than that, patience is a virtue.
Seasonality: Gold – Patience Is A Virtue
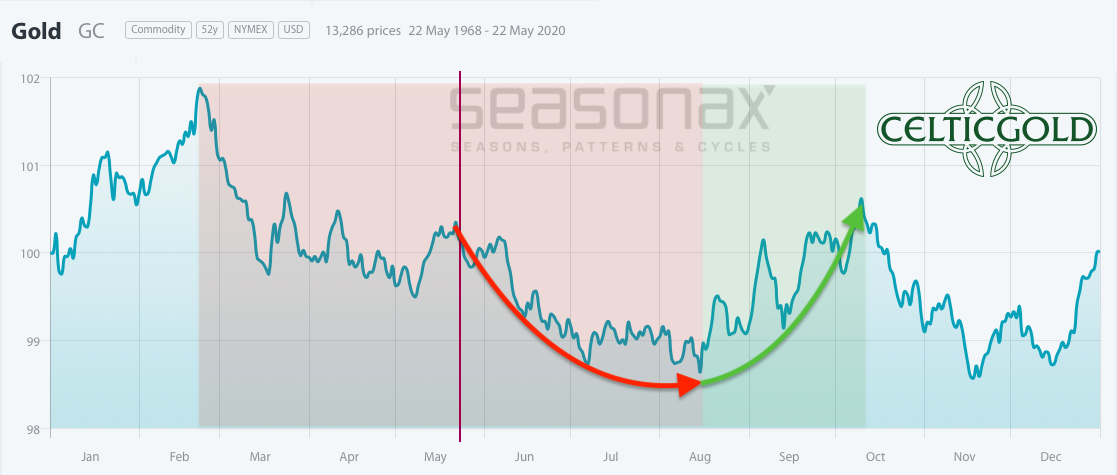
For the next five to ten weeks the seasonal pattern is not supporting rising gold prices. Typically, June is the month of pullbacks in the gold market, which usually bottom out in July or mid August at the latest. Should a similar pattern occur this year, a good buying opportunity would present itself. By the way, these summer lows often also marked the low for the year.
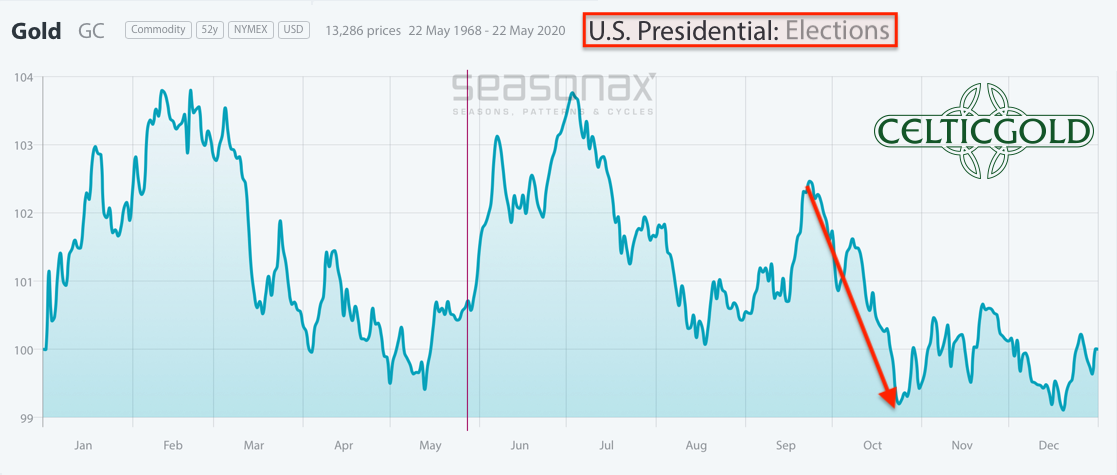
This year however, the U.S. presidential elections, which are scheduled for November 3rd, must also be taken into account. This event should determine the second half of the year for financial markets in general. The American central bank FED will certainly do everything possible to prevent the markets from collapsing before these elections. The further expansion of the money supply necessary for this should certainly support precious metal prices on the one hand. On the other hand, however, there is also a statistical pattern which indicates potential difficulties for gold in the second half of the year. In front of the last U.S. presidential election in 2016, gold had gotten stuck around US$1,350 to 1,375 in the summer months and then corrected down to US$1,123 by mid-December.
In conclusion, the seasonal outlook currently recommends a patient and wait-and-see stance. Should there be a pullback within the next two months, it would be a good buying opportunity. If, on the other hand, prices remain stable around and above US$1,700 in June and July, the danger increases that the unfavorable U.S. election cycle will start to affect gold from late summer.
Bitcoin/Gold-Ratio
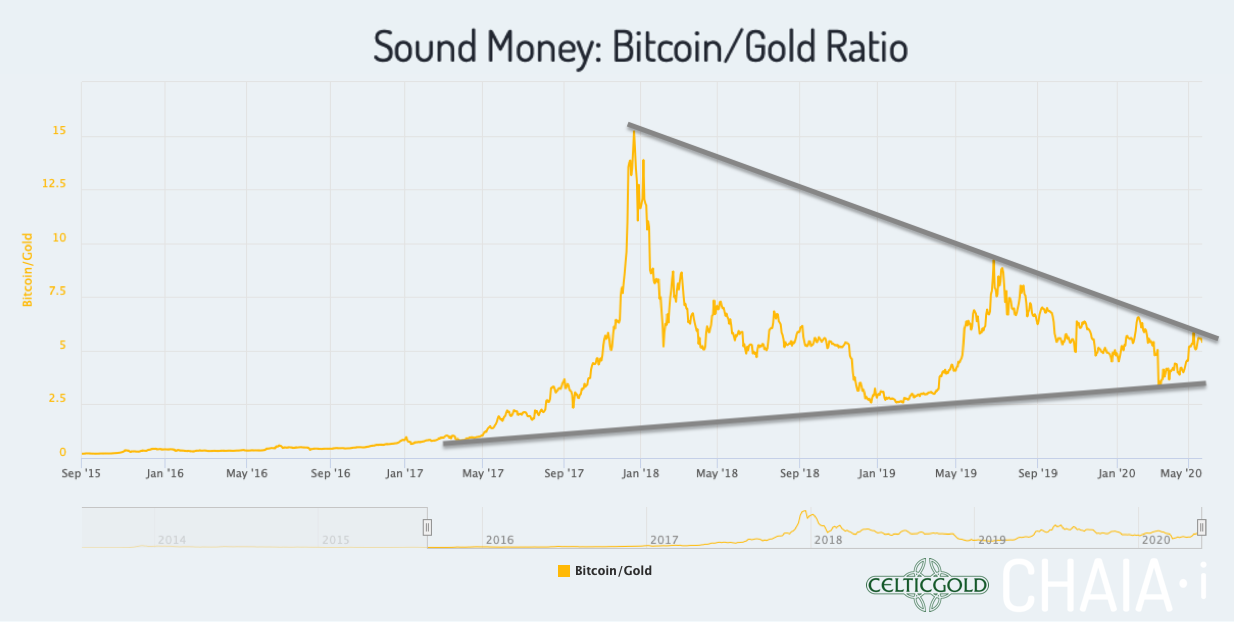
Currently, you have to pay 5.15 ounces of gold for one Bitcoin. In other words, a troy ounce of gold currently costs only 0.194 Bitcoin. Since the low point of the corona crash, Bitcoin has been able to outperform gold by a considerable margin. On top, since the second week of May, Bitcoin has been knocking at the upper edge of the large consolidation triangle once again. Thus, the chances of a breakout to the upside continue to rise. Only if there would be another blatant attack of weakness in Bitcoin we would have to prepare for another round of consolidation lasting several months. Otherwise, and that is what it looks like at the moment, the breakout from the triangle is imminent in these weeks until the summer. Subsequently, a sharp rise in Bitcoin prices would be the logical consequence.
Generally, buying and selling Bitcoin against gold only makes sense to the extent that one balances the allocation in the two asset classes! At least 10% but better 25% of one’s total assets should be invested in precious metals (preferably physically), while in cryptos and especially in Bitcoin one should hold at least 1% up to 5%. Paul Tudor Jones holds a little less than 2% of his assets in Bitcoin. If you are very familiar with cryptocurrencies and Bitcoin, you can certainly allocate higher percentages to Bitcoin and maybe other Alt-coins on an individual basis. For the average investor, who is normally also invested in equities and real estate, 5% in the highly speculative and highly volatile bitcoin is already a lot!
“Opposites compliment. In our dualistic world of Yin and Yang, body and mind, up and down, warm and cold, we are bound by the necessary attraction of opposites. In this sense you can view gold and bitcoin as such a pair of strength. With the physical component of Gold and the digital aspect of Bitcoin you have a complimentary unit of a true safe haven in the 21st century. You want to own both!” – Florian Grummes
Conclusion and Recommendation: Gold – Patience Is A Virtue
Gold doesn’t seem to know where it’s going these days. For weeks now, prices have been clearly trading above US$1,700 and trying to break through the resistance zone between US$1,740 and 1,765 only to fall all the way back to and slightly below US$1,700. At the same time, volatility has been on retreat since March 19th. At least things have calmed down a bit in the gold market. But the bulls still have the upper hand. The bears, on the other hand, have been making increased efforts to reverse the trend since the last high point at US$1,765. Apart from a decline to just under US$1,700, however, they have not (yet) achieved much.
Generally, we should always remember that just before the biggest rises in the gold market, all weak hands are usually shaken off. In this respect, a pullback in early summer remains the preferred scenario. This way, gold prices do not have to fall so extremely low. A decline to US$1,650 or to the rising 200-day line in the US$1,600 range would presumably be completely sufficient. Afterwards, gold would be ready for the next wave up, which should then target the resistance around US$1,800 as well as the all-time high at USD$1,920.
If, on the other hand, gold prices can hold steady above US$1,700 throughout the coming two to three months, the probability increases that there will be a more pronounced correction starting in late summer just a few months before the U.S. elections.
Either way, the risk/reward-ratio for gold is not ideal at the moment. It is therefore advisable to simply remain patient and wait at least until an oversold setup on the daily chart and ideally also on the weekly chart. However, one should not lose sight of gold, because in times of unconditional stimuli from almost all central banks worldwide, every somewhat larger pullback already means a buying opportunity in the gold market.
- Looking forward to the next few months: Gold – Patience Is A Virtue.
- Very short-term and we are talking one-hour and four-hour charts, an oversold bounce should take gold back towards US$1,730 at least.
In the very big picture, gold should be heading towards its all-time high of US$1,920 and then continue its rise further into the mid of US$2,000 region.