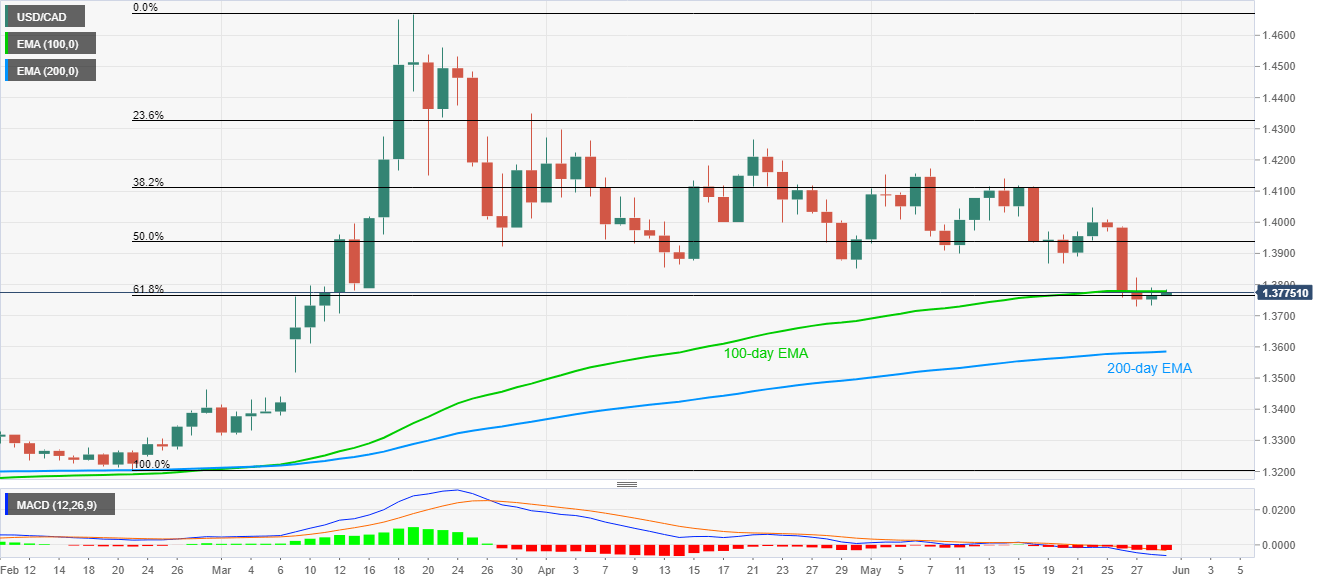
USD/CAD Price Analysis: Seesaws between 61.8% Fibonacci retracement, 100-day EMA
by Anil Panchal- USD/CAD steps back from 100-day EMA, still positive on a day above the weekly low of 1.3728.
- 200-day EMA offers additional support below 61.8% Fibonacci retracement.
- May 19 low, 50% Fibonacci retracement can challenge the buyers.
USD/CAD drops from the intraday high of 1.3785 to 1.3773 amid the initial hour of Tokyo trading on Friday. In doing so, the pair retreats from 100-day EMA but stays above 61.8% Fibonacci retracement level of February-March upside.
Even so, the bearish MACD and a failure to carry the bounce off 1.3728 favors the sellers.
As a result, odds of the pair’s drop to a 200-day EMA level of 1.3585 become brighter if it breaks the immediate supports surrounding 1.3765 and 1.3730.
On the contrary, an upside clearance of a 100-day EMA level of 1.3780 might not help the bulls regain the throne as May 19 low near 1.3865/70 and 50% Fibonacci retracement level of 1.3940 stand all as near-term key resistances.
USD/CAD daily chart

Trend: Bearish
Additional important levels
| Overview | |
|---|---|
| Today last price | 1.3774 |
| Today Daily Change | 11 pips |
| Today Daily Change % | 0.08% |
| Today daily open | 1.3763 |
| Trends | |
|---|---|
| Daily SMA20 | 1.3982 |
| Daily SMA50 | 1.405 |
| Daily SMA100 | 1.3712 |
| Daily SMA200 | 1.3456 |
| Levels | |
|---|---|
| Previous Daily High | 1.379 |
| Previous Daily Low | 1.3734 |
| Previous Weekly High | 1.4114 |
| Previous Weekly Low | 1.3867 |
| Previous Monthly High | 1.4299 |
| Previous Monthly Low | 1.385 |
| Daily Fibonacci 38.2% | 1.3769 |
| Daily Fibonacci 61.8% | 1.3755 |
| Daily Pivot Point S1 | 1.3735 |
| Daily Pivot Point S2 | 1.3707 |
| Daily Pivot Point S3 | 1.3679 |
| Daily Pivot Point R1 | 1.3791 |
| Daily Pivot Point R2 | 1.3818 |
| Daily Pivot Point R3 | 1.3846 |