AUD/JPY Price Analysis: Depressed above 71.00 after Japanese statistics
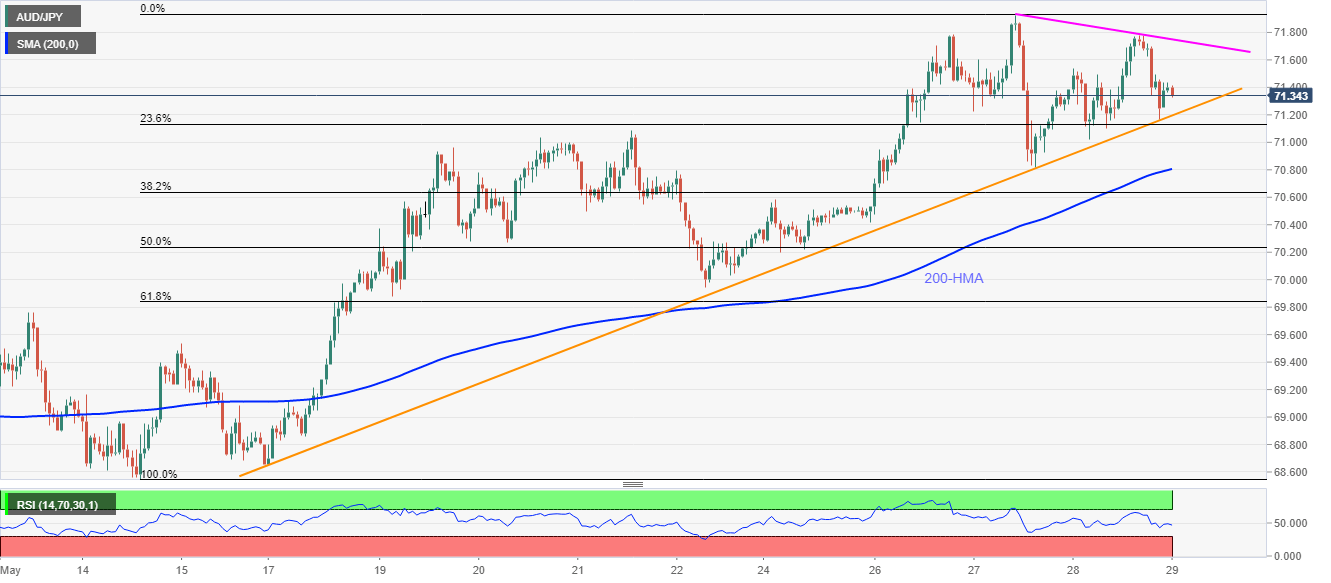
by Anil Panchal- AUD/JPY fails to extend the bounce off 71.17 much beyond 71.43.
- Japan’s Retail Sales, Tokyo CPI and Unemployment Rate flashed better than forecast results.
- 200-HMA adds to the downside support below a two-week-old rising trend line.
- Buyers will wait for a sustained break above the weekly resistance line.
AUD/JPY drops to 71.33 after the key economics from Japan recently weighed on the pair amid the initial Asian session on Friday.
Read: Tokyo area May Core CPI +0.2% YoY smashes estimates of ‐0.2%
Even so, the quote stays above an upward sloping trend line stretched from May 15, at 71.20 now, a break of which could drag the AUD/JPY prices towards a 200-HMA level of 70.80.
In a case where the bears dominate past-70.80, 70.00 and May 13 top near 69.75 could become their favorites.
Meanwhile, 71.55 my offer immediate resistance ahead of the weekly falling trend line, currently around 71.75.
Should there be a clear run-up beyond 71.75, 72.00 and January month low near 72.45 may return to the charts.
AUD/JPY hourly chart

Trend: Bullish
Additional important levels
| Overview | |
|---|---|
| Today last price | 71.4 |
| Today Daily Change | -0.04 |
| Today Daily Change % | -0.06% |
| Today daily open | 71.44 |
| Trends | |
|---|---|
| Daily SMA20 | 69.79 |
| Daily SMA50 | 68.39 |
| Daily SMA100 | 70.28 |
| Daily SMA200 | 72.14 |
| Levels | |
|---|---|
| Previous Daily High | 71.78 |
| Previous Daily Low | 71.02 |
| Previous Weekly High | 71.08 |
| Previous Weekly Low | 68.65 |
| Previous Monthly High | 70.17 |
| Previous Monthly Low | 64.4 |
| Daily Fibonacci 38.2% | 71.49 |
| Daily Fibonacci 61.8% | 71.31 |
| Daily Pivot Point S1 | 71.05 |
| Daily Pivot Point S2 | 70.65 |
| Daily Pivot Point S3 | 70.28 |
| Daily Pivot Point R1 | 71.81 |
| Daily Pivot Point R2 | 72.18 |
| Daily Pivot Point R3 | 72.57 |