Fevertree: Compounder For The Long-Term Investor
by Arnoud van der ArkSummary
- Fevertree shows outstanding performance compared to its close peers.
- An outsourced business model leads to high profit margins and returns on capital, and has allowed the firm to keep a clean balance sheet.
- Network effects form a moat around the company, protecting it from competitors.
- Stalling growth has lead to a severe stock price decline and the market pricing in an overly pessimistic future.
- The risk/reward profile is attractive as it is skewed to the upside.
Editor's note: Seeking Alpha is proud to welcome Arnoud van der Ark as a new contributor. It's easy to become a Seeking Alpha contributor and earn money for your best investment ideas. Active contributors also get free access to SA PREMIUM. Click here to find out more »
Investment thesis and structure
I think that the market underestimates Fevertree's potential and that the security is undervalued. Since growth has slowed down in the second half of 2018, the share price has declined by approximately 55%. The current price reflects a very modest future earnings growth, which I think is overly pessimistic given its track-record, moat, and opportunities ahead.
After a brief introduction of Fevertree, I start with an industry analysis to show that the firm outperforms its close peers. Following this, I analyze the company in-depth to explain what causes this outperformance and whether this outperformance is likely to continue happening in the future. Performing this fundamental company analysis gives me confidence for the next step, which is to look at the firm's valuation and compare the implied market expectations to my own expectations. This leads me to quantify the risk/reward profile, showing that the profile is skewed to the upside.
About Fevertree
Back in 2003, Charles Rolls and Tim Warrillow recognized a strongly growing demand for premium spirits. The problem for the consumers of these premium spirits, however, was a lack of premium mixers. When combining a premium spirit with a low-quality mixer, it is the low-quality aspect that wins over the premium aspect. With this in mind, Charles and Tim founded Fevertree in 2004 - now known as a key player in the premium drink mixer industry.

(Figure 1 - Cover image. Retrieved from Fevertree's website.)
The drink mixer industry
The industry can be segmented into a regular segment and a premium segment, of which the premium segment is the youngest and driving factor of overall market growth (Source: EY 2014, "The mixer market" section of Fevertree's admission document). This is mostly the result of two underlying trends, namely premiumization and spirits gaining market share over beer. As depicted in figure 2, spirits made up 39% of the global market share in 2012 which is expected to grow to 42% in 2022. As depicted in figure 3, the Premium to Prestige Plus price brackets have grown at a significantly higher pace over the last 10 years than the Low Price to Standard price brackets. As Fevertree's products are mixed with premium spirits, these two trends are a tailwind for the company.
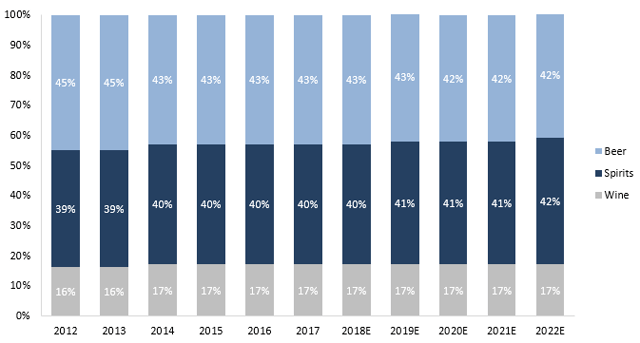
(Figure 2 - Global market share divison between beer, spirits and wine. Created by author using data retrieved from Global Spirits Primer 2018, Bank of America Merrill Lynch.)
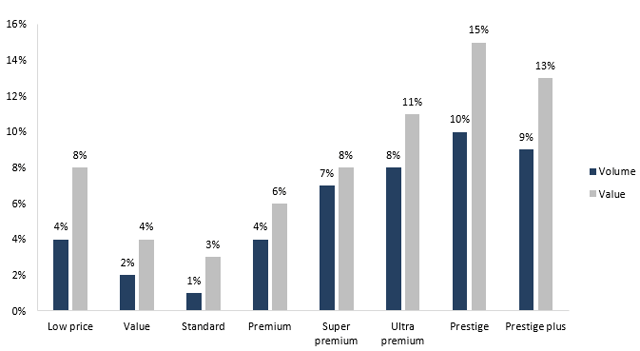
(Figure 3 - 10 year compounded annual growth rates for volume and value per price bracket. Created by author using data retrieved from Global Spirits Primer 2018, Bank of America Merrill Lynch.)
Analysis of key players
Besides Fevertree, the drink mixer industry contains various players of which some are publicly listed, and some are private. The most significant public companies are Keurig Dr Pepper (Schweppes), Coca-Cola (Signature Mixers), Britvic (London Essence) and A.G. Barr (Funkin Cocktails). The most significant private companies are Double Dutch Drinks and Fentimans.
To get an idea of how the various companies perform, the average profit margins and returns on invested capital over the last 5 years (2015-2019) are analyzed. As Double Dutch Drinks has not publicized its financials, only Keurig Dr Pepper, Coca-Cola, Fevertree, Britvic, A.G. Barr, and Fentimans are analyzed. Fentimans has not reported 2019 financials yet, resulting in a 4-year average being used.
Comparison of gross profit margins across key players
Looking at the 5-year average gross profit margin, the best performer is Coca-Cola with 62%. The worst performer is Fentimans with 29%. The average among the companies is approx. 50%. With 53%, Fevertree has decent but not best-in-class gross profit margins.
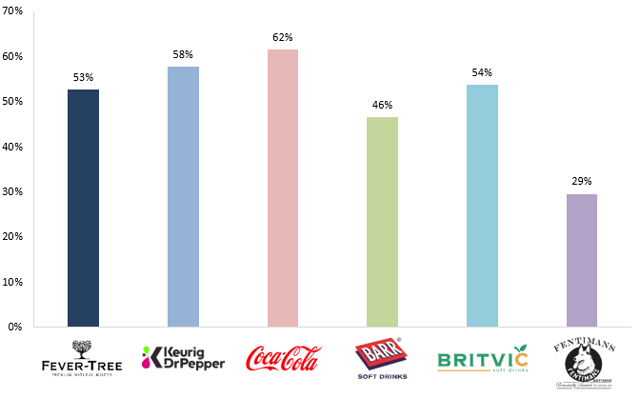
(Figure 4 - Gross profit margins over the last 5 reported years. Graph created by author, public company data retrieved from investor relations websites and private company data retrieved from Companies House.)
Comparison of operating profit margins across key players
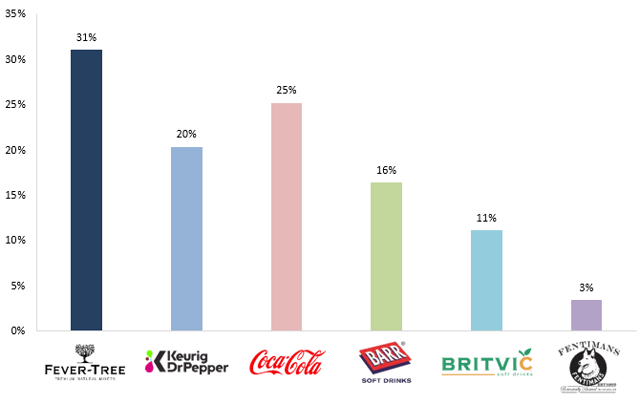
Looking at the 5-year operating profit margins for the various players shows that the margins differ quite a lot. The average margin hovers a bit below 20%, with Fentimans having the lowest margins of approx. 3% and Fevertree having the highest margins of approx. 31%. The fact that Fevertree's operating earnings are significantly higher than all of its competitors while its gross profit margins were not extraordinary shows that the firm controls its opex very well.(Figure 5 - Operating profit margins over the last 5 reported years. Graph created by author, public company data retrieved from investor relations websites and private company data retrieved from Companies House.)
Comparison of returns on capital across key players
Like the gross margins and operating profit margins, returns on capital vary quite a lot. The average seems to be somewhere between 20-25%, which is relatively high. An interesting observation is how Keurig Dr Pepper has relatively high operating profit margins, but due to its capital-intensive business model, its returns are among the lowest of the selected companies. Fevertree is the best performer by a wide margin.
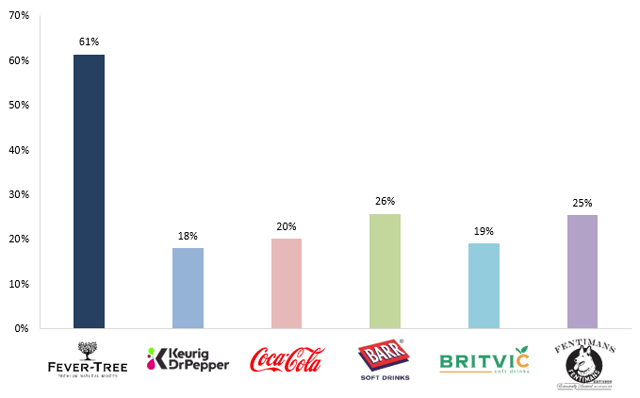
(Figure 6 - Returns on invested capital over the last 5 reported years. Graph created by author, public company data retrieved from investor relations websites and private company data retrieved from Companies House.)
In-depth analysis of Fevertree
The industry analysis shows that Fevertree stands out among its peers, warranting a deeper analysis of why this might be and whether the outperformance can be expected to continue.
Business model and past performance
The firm utilizes a business model that outsources production and bottling to third parties. This allows the firm to focus on its most important activity - sourcing ingredients and making drinks - while taking on minimal operational risk. The company positions itself as a premium producer of drink mixers made for premium spirits, meaning it gets to charge premium prices and benefit from both the underlying premiumization trend and the increasing popularity of spirits. Together, these two factors allow Fevertree to reach margins far higher than its competitors as shown in the industry analysis section.
In 2019, Fevertree generated approximately 50% of its revenue in its home market - the United Kingdom. The performance in this market is a great illustrator of what the firm is capable of. Before Fevertree was founded, Schweppes was the largest incumbent with more than half the market share belonging to them. But Schweppes had a weak ownership structure with over 10 companies owning the brand and no central brand management. Therefore, despite its leading position and stronger financial backbone, it was not able to fend off Fevertree's offense. This lead Fevertree to grow from a market share of approximately 5% in 2013 to 42% in the end of 2018, while Schweppes' market share declined from over 50% to 30% in the same period. And what is perhaps even more impressive is that Fevertree's business model and the resulting high profit margins have allowed the company to win this offense while maintaining a healthy balance sheet that is free of debt and even holds a net cash position of GBP 128.3m at the end of 2019.
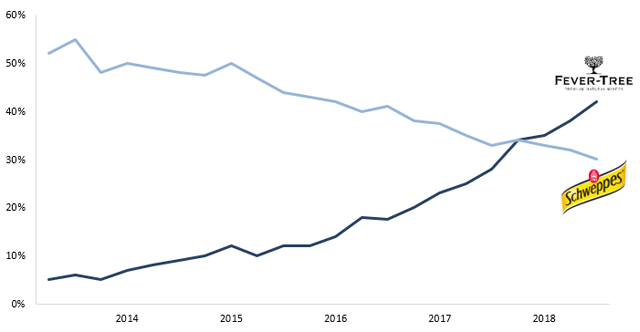
(Figure 7 - Fevertree versus Schweppes market share development in the UK retail. Created by author using data retrieved from Fevertree's 2018 earnings presentation.)
Expected future performance
I have various reason for being confident that Fevertree is likely to continue performing strongly, as outlined below.
Network effects form a moat
I think the firm has a moat, of which the ability to maintain high margins and excess returns on invested capital serve as quantitative evidence. Only quantitative evidence does not count, however, and critical reasoning is a necessity in order to determine whether the firm truly has a moat.
My qualitative reasoning for the firm having a moat is that it has a first-mover advantage which it uses to establish a dominant position in the on-trade early on. Over the years, Fevertree has used industry influencers to push its products into the on-trade channel and it reports that it is market leader in the UK on-trade industry and focuses on doing the same in other geographies. The reason why I think this is of such importance is that I think it creates network effects which gives the company its competitive advantage and consequently forms its moat. The process is as follows. By successfully convincing bartenders to use Fevertree mixers, the bartenders will tend to see the product as the industry standard and a must-have. The bartenders using the products then create awareness of the products among its visitors. Its visitors are then more likely to buy the products whenever they come across it in the retail channel. If they sufficiently enjoy the products, they are now much more likely to demand the products whenever they visit an on-trade premise. This reinforces the idea of bartenders that Fevertree's products are a must-have and the cycle repeats. Early on, this network effect might not be as significant. But later, after the cycle has repeated many times, I believe its effect will be highly significant.
To break this cycle, new entrants could either attack in the retail channel to convince customers that their product is better, or in the on-trade channel to convince bartenders of this. Convincing customers in the retail channel, however, will require a significant marketing budget which a new entrant is unlikely to be able to cough up. Furthermore, bartenders are unlikely to reserve space for many different mixers and will probably prefer to go with a single brand. Thus, the entrant would have to convince bartenders that its product is that much better that it will drop Fevertree altogether. Attacks on both of these fronts will certainly take place, but I deem huge successes to be quite unlikely. At the very least, it creates a playing field that is tilted in favor of Fevertree and provides significant protection.
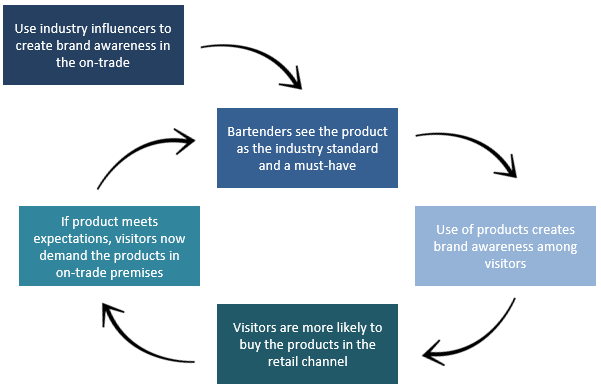
(Figure 8 - Network effects. Created by author.)
Growth areas
As mentioned in the first section of this write-up, stalling growth has spooked investors. I think that there is still plenty of room for growth, however. Premium mixers seem to be most popular in the gin and tonic market, but over time I believe mixers will become more popular for a wider variety of drinks. The company also still grows solidly in other geographies and with its track-record of beating significant competition, I am convinced Fevertree will manage to continue to do so. Figure 9 depicts Fevertree's market share and room for growth in a variety of its markets, illustrating that the growth opportunities are far from scarce. Furthermore, I believe that the management team is just as convinced of this as I am, as proven by significant management ownership. Charles rolls currently holds 7.1% of shares while Tim Warrillow holds 4.7%. Furthermore, after facing headwinds and a significant drop in share price around January 2020, non-executive directors have purchased shares amounting to more than GBP 500k. Management with such an amount of skin in the game and aligned interests only make it that much easier to sleep well at night.
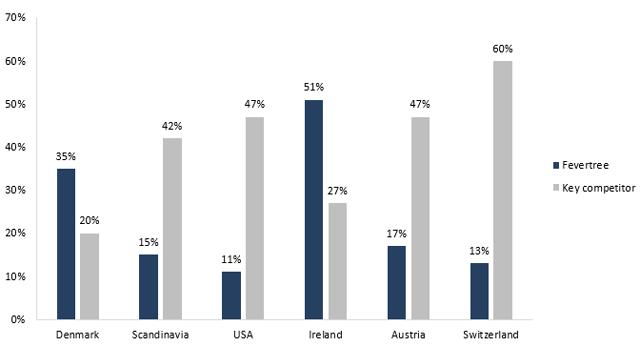
(Figure 9 - 2018 market share of Fevertree and its key competitor, per country. Created by author using data retrieved from Fevertree's 2018 earnings presentation.)
COVID-19 impact
Although the COVID-19 crisis is a setback for everyone, I believe that Fevertree will survive the crisis with ease. With its net cash position of GBP 128.3m, the firm could pay its SG&A of 2019 for two more years, and still not run out of cash. Taking a long-term perspective, the greatest drawdown is the temporary delay in building the Fevertree brand as most on-trade marketing campaigns have been cancelled. However, the strength of the firm's brand has been illustrated by the fact that in the UK the week before the lockdown, sales grew by a whopping 70% and has grown at a steady 20% growth after the lockdown commenced. Furthermore, I believe that the crisis will hurt smaller-sized players significantly while blocking new entrants from coming in. This effectively buys Fevertree extra time to strengthen its current position and continue to operate in an environment where competition is weakened, and the playing field is tilted in Fevertree's favor.
Valuation and risk/reward profile
Although valuation is far from an exact science, it allows the investor to get an idea of what the market is currently pricing in and thus what degree of performance it takes to increase firm value. This section serves this purpose and quantifies the potential upside and downside.
The valuation method that I use
When it comes to valuation, I like to use Warren Buffett's method of calculating owner earnings, projecting them into the future and then discounting them by the long-term interest rate. To do this, I forecast owner earnings for the next 10 years and then calculate a steady-state terminal value for the years after that. First, I try to get an idea of what the market has currently priced in through adjusting the various inputs. After, I adjust the firm's growth rates to get an idea of what the intrinsic value might be for each scenario and what the upside and downside potentials are in each of these scenarios.
Using the long-term interest rate as the discount rate will naturally lead to a higher value than using the cost of equity derived from using the Capital Asset Pricing Model (CAPM), and I expect readers to have a critical stance towards me neglecting the CAPM. The reason I don't use it is because I want to get an objective value of what the cash flows are worth as opposed to a value where the "risk" component tries build in a margin of safety for me. I'd rather see the true value and determine for myself whether I think the upside potential in combination with downside protection - such as having a net cash position, a moat, and a low-risk business model - is a sufficient margin of safety.
Model input
As owner earnings uses net income, adds back depreciation & amortization and non-cash charges and deducts capital expenditures and increases in working capital, five inputs are of main importance. These are the tax rate, long-term interest rate, the revenue growth rate, expected margins, and the changes in working capital.
For each model, the following input are used. The tax rate is set to the UK corporate tax rate, which is equal to 19%. The long-term interest rate is rather difficult to assume, so I simply use a conservative 5%. I expect gross profit and operating profit margins to remain at a level equal to those of 2019. The margins were not historically high in 2019 (28% EBIT vs 31% over the last 5 years), and therefore this assumption is relatively conservative in my eyes. The changes in working capital are calculated using the average days payable outstanding, days inventory outstanding, and days sales outstanding over the last 5 years. Capital expenditures and D&A are calculated using the 5-year average percentage of sales, which are 0.8% and 1.0%, respectively.
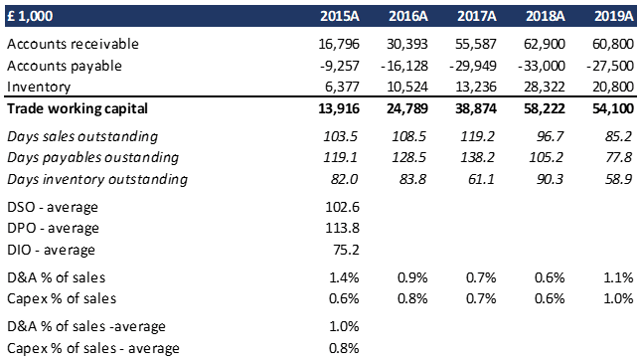
(Figure 10 - Calculation of DSO, DPO, and DIO to be used as input for the model. Created by author using financial data retrieved from investor relations website of Fevertree.)
My perception of current market expectations
As COVID-19 will certainly impact 2020 and possibly 2021, I choose to be conservative and expect revenue to decrease by 50% in 2020 (base year is 2019) and to decrease by 25% in 2021 (base year again 2019). In 2022, earnings growth is set to equal 2.5% growth using 2019 as the base year. For the rest of the periods up to year 10 as well as during its steady-state growth period, earnings growth is set to equal 2.5%. Doing this results in an intrinsic value that is roughly equal to the current market capitalization of Fevertree, leading me to believe that the market currently thinks that the company will grow at approximately 2.5% indefinitely, slightly above UK target inflation levels.
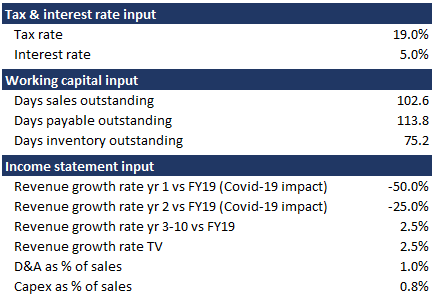
(Figure 11 - Model input used to check market assumptions. Created by author.)
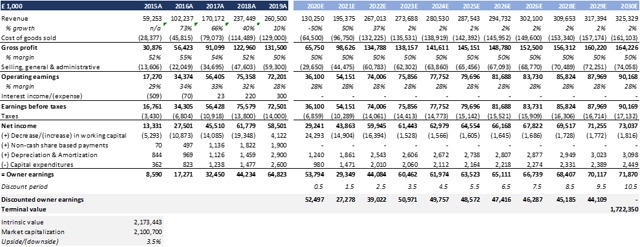
(Figure 12 - DCF model output used to check market assumptions. Created by author.)
My perception of Fevertree's intrinsic value
For the following section, it is important to keep in mind that calculating the intrinsic value of a business is much more of an art than a science, and ultimately the true value will depend on whether the company's moat widens or shrinks over the projected period. First, I use a negative scenario to get an idea of what the downside looks like. Then, I use a neutral and high-growth scenario to get an idea of what I think the intrinsic value should approximately be and what the upside potential is. For each model, 2020 and 2021 (years 1 and 2) are adjusted for COVID-19, like I did in the previous section.
Negative scenario
In the negative scenario, I put the revenue growth rate for years 3-10 at -2.0% and the terminal growth rate at -0.5%. Given the industry dynamics and Fevertree's position, I think that this is a realistic negative scenario. Revenue and earnings might not decline in such a predictive and steady way, but it is a best estimate. When using these growth rates, the downside is roughly 55%. The discounted cash flow model in figure 13 shows what this scenario looks like.
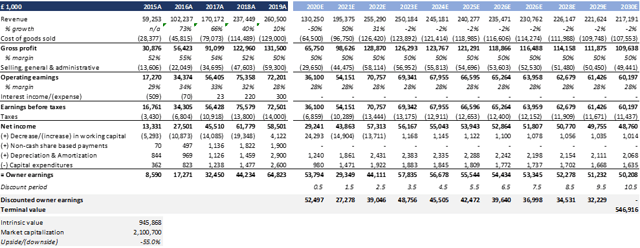
(Figure 13 - DCF model output using negative scenario. Created by author.)
Base scenario
In the base scenario, I put the revenue growth rate for years 3-10 at 10.0% and the terminal growth rate at 2.0%. Given the industry dynamics and Fevertree's position, I think that this is a realistic base scenario. In the past it has grown earnings at a significantly higher rate (56% CAGR between 2011 and 2019) and the 2.0% terminal growth rate is roughly at level of inflation, which I think is still quite conservative. While revenue and earnings growth might not be as steady, I think this is a relatively good best estimate. When using these growth rates, the upside is roughly 47%. The discounted cash flow model in figure 14 shows what this scenario looks like.
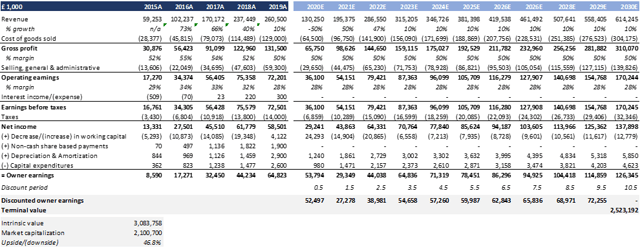
(Figure 14 - DCF model output using base scenario. Created by author.)
Growth scenario
In the growth scenario, I put the revenue growth rate for years 3-10 at 15.0% and the terminal growth rate at 2.0%. Given the industry dynamics and Fevertree's position, I think that this is a realistic growth scenario. In the past it has grown earnings at a significantly higher rate (56% CAGR between 2011 and 2019) and the 2.0% terminal growth rate is roughly at level of inflation, which I think is still quite conservative. While revenue and earnings growth might not be as steady, I think this is a relatively good best estimate. When using these growth rates, the upside is roughly 102%. The discounted cash flow model in figure 15 shows what this scenario looks like.
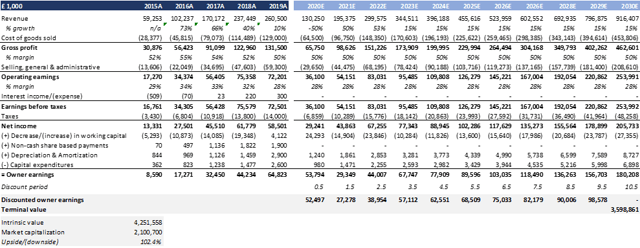
(Figure 15 - DCF model output using growth scenario. Created by author.)
Conclusion: Fevertree's intrinsic value and risk/reward profile
I think the most realistic case for Fevertree lies between the base scenario and growth scenario, and therefore I think that its intrinsic value is approximately 47-102% higher than its current market value. For this scenario to be true, the company will have to grow its revenue by approximately 2.4x - 3.5x over the next 10 years while maintaining 28% operating margins. If the negative scenario is true, approximately 55% downside is what I see as a likely case. The company would have to suffer severely for this to happen, however, and I think its competitive position will avoid such a fate. I do not see any hard catalysts on the horizon, but I believe continuous earnings growth will be the key to unlocking its intrinsic value in the base/growth scenario.
Investment risks
In this write-up, the assumption is made that Fevertree can successfully move away from being mostly a gin and tonic player to an all-round drink mixer player. Management unfortunately does not report revenue per product line (except in the admission document of 2014, but this is now too outdated to be of use), which would have been highly useful to have. The firm does seem to put a strong emphasis on diversifying away from its tonics, however, and is planning to pursue its next growth phase in the US with a new mixer made specifically for tequila. The drink mixer industry is also still relatively young, and it is possible that consumers simply do not care enough about (premium) mixers and that the industry has already peaked. I think the US experiment with the new tequila mixer will be an important test to check whether this is the case. Besides this, the network effects that are supposed to form a moat around the firm and protect its market position, margins, and capital returns going forward could be weaker than I perceive them to be.
Conclusion
My conclusion is that Fevertree is an attractive buy. The market prices in very little growth, and I am convinced that this is overly pessimistic and that its competitive position will ensure future success. The risk/reward is skewed to the upside with downside protection being offered by the firm's net cash position, outsourced business model, and its moat.
Disclosure: I am/we are long FQVTF. I wrote this article myself, and it expresses my own opinions. I am not receiving compensation for it (other than from Seeking Alpha). I have no business relationship with any company whose stock is mentioned in this article.