The Rally Continues, Now Thanks To Small-Caps (Technically Speaking For 5/27)
by Hale StewartSummary
- The EU and Japan have announced major stimulus programs.
- While existing home sales have dropped sharply, new home sales are surprisingly resilient.
- The markets continue moving higher.

The Fed released the latest Beige Book. It's an understandably depressing read:
Economic activity declined in all Districts – falling sharply in most – reflecting disruptions associated with the COVID-19 pandemic. Consumer spending fell further as mandated closures of retail establishments remained largely in place during most of the survey period. Declines were especially severe in the leisure and hospitality sector, with very little activity at travel and tourism businesses. Auto sales were substantially lower than a year ago, although several Districts noted recent improvement. A majority of Districts reported sharp drops in manufacturing activity, and production was notably weak in auto, aerospace, and energy-related plants. Residential home sales plunged due in part to fewer new listings and to restrictions on home showings in many areas. Construction activity also fell as new projects failed to materialize in many Districts. Commercial real estate contacts mentioned that a large number of retail tenants had deferred or missed rent payments. Bankers reported strong demand for PPP loans. Agricultural conditions worsened, with several Districts reporting reduced production capacity at meat-processing plants due to closures and social distancing measures. Energy activity plummeted as firms announced oil well closures, which led to historically low levels of active drilling rigs. Although many contacts expressed hope that overall activity would pick-up as businesses reopened, the outlook remained highly uncertain and most contacts were pessimistic about the potential pace of recovery.
I'll cover more of the underlying data in my Friday market recap.
The EU and Japan plan to increase fiscal spending (emphasis added):
Japan’s cabinet on Wednesday approved more than a trillion dollars in stimulus funds, including a combination of subsidies to companies and people. The Parliament is expected to approve the measure next month. The European Commission, the European Union’s executive arm, similarly said it would introduce a plan for measures worth 750 billion euros, or about $826 billion. One measure being considered was a proposal from Chancellor Angela Merkel of Germany and President Emmanuel Macron of France for a joint fund of €500 billion for European Union countries severely affected by the virus.
This is macro 101: when demand declines the government should use its fiscal authority to fill in the gaps. In my opinion, the large amount of macro spending is a big reason why stocks are so buoyant.
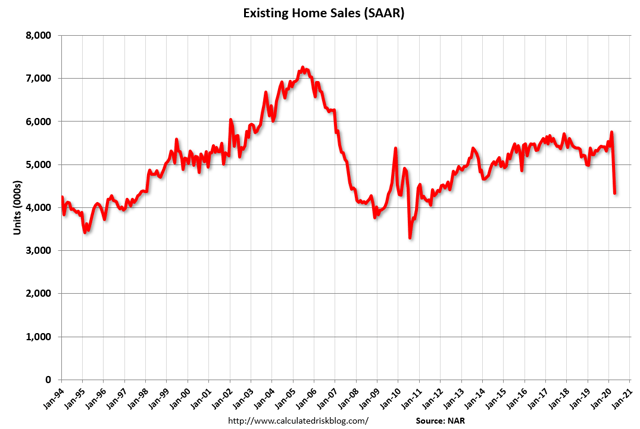
We now have a complete set of housing market data for May. Existing home sales -- which account for about 90% of housing market activity -- were down 17.8% M/M and 17.2% Y/Y. Chart from Calculated Risk
New home sales actually rose slightly in the latest report (emphasis added):
Sales of new single-family houses in April 2020 were at a seasonally adjusted annual rate of 623,000, according to estimates released jointly today by the U.S. Census Bureau and the Department of Housing and Urban Development. This is 0.6 percent (±14.9 percent)* above the revised March rate of 619,000, but is 6.2 percent (±17.1 percent)* below the April 2019 estimate of 664,000.
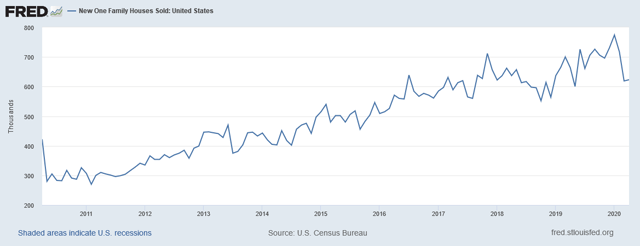
The data is surprisingly strong:There's a good possibility that we'll see this data drop soon due to the delayed effects of the lockdown. But so far, the new home sales market is surprisingly resilient.
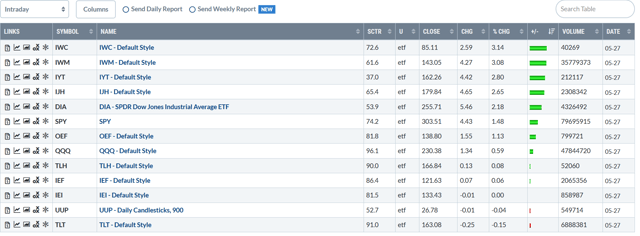

Let's look at today's performance tables:Smaller-caps are still leading the market higher, which indicates a "risk-on" mentality. Larger-caps also moved higher but to a lesser degree. As has been the case for most of this rally, the long end of the Treasury market isn't moving lower. All sectors moved higher, with financials leading the pack. Industrials and consumer discretionary round out the top four slots. At the bottom are tech and communication services, which have led the market higher until now.

Let's start with the Treasury market: The Treasury market remains pegged at high levels, which indicates there is still a very strong safety bid in the market.
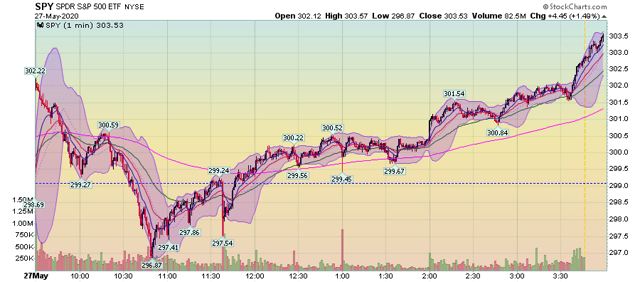
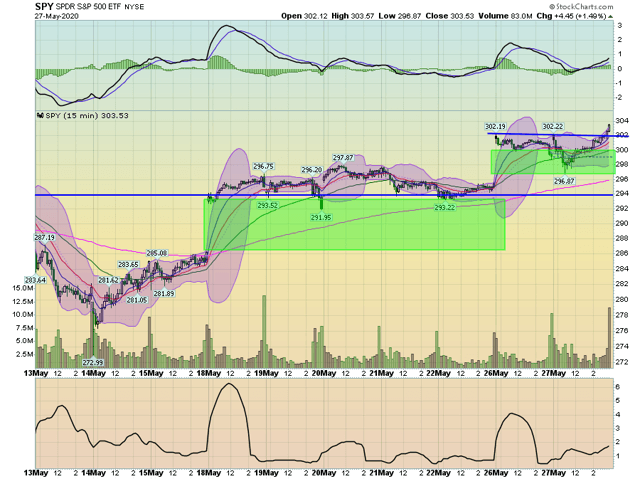
Now, let's look at the equity markets, starting with today's chart:The market gapped higher at the open but trended lower until just before 11 AM. Then, the market started a rally that lasted the rest of the day. Best of all, in the last hour prices made a strong move higher.Let's pull the lens back to the 2-week time frame. For the second week in a row, prices gapped higher on Monday. There was a modest downward trend which filled most of Monday's gap higher. Today's rally sent the market through highs around the 302 level.
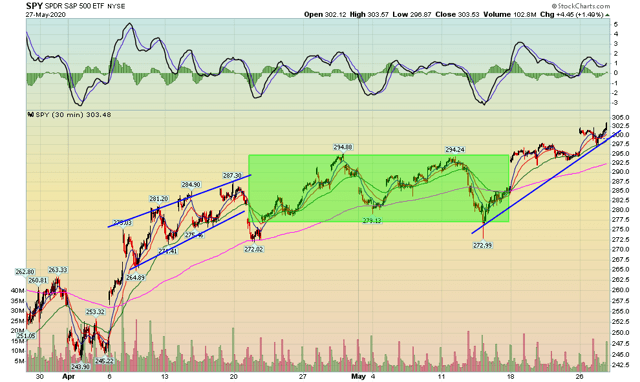
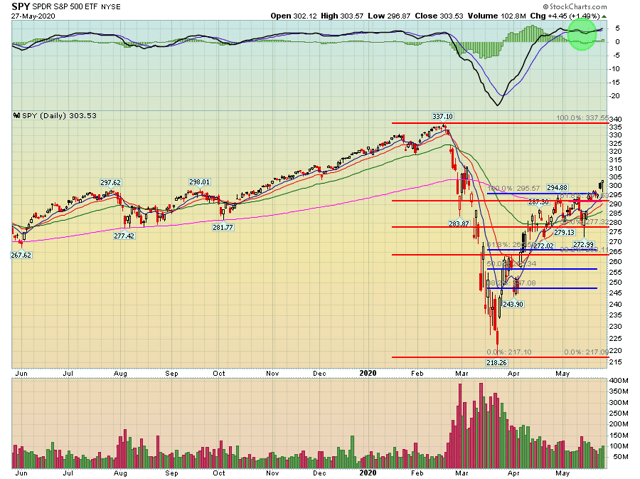
On the 30-day chart, prices are in an up, consolidate, up pattern. This is a solid bull market pattern. On the daily chart, prices are still in a solid uptrend. They have advanced through all the key Fibonacci levels, which are pulling all the EMAs higher.
Overall, the market remains in a solid uptrend. The best part of this is the strong advance in smaller-cap indexes, which indicates a healthy risk appetite. The only drawback is the high level of the Treasury market.
Disclosure: I/we have no positions in any stocks mentioned, and no plans to initiate any positions within the next 72 hours. I wrote this article myself, and it expresses my own opinions. I am not receiving compensation for it (other than from Seeking Alpha). I have no business relationship with any company whose stock is mentioned in this article.