Technology And Communication Dashboard - May Edition
by Fred PiardSummary
- Valuation metrics in information technology and communication services.
- Evolution since last month.
- A list of stocks looking cheap in their industries.
This article series provides a monthly dashboard of industries classified by sectors. It compares valuation and quality factors relative to their historical averages in each industry.
Executive summary
Computers/peripherals and wireless telecom are underpriced relative to historical averages, and above the profitability baseline measured by return on equity. Electronic equipment is close to fair price. All other IT and communication industries are overpriced. Diversified telecom is significantly above its historical baseline in profitability, which may partly justify overpricing. Entertainment and software are the most overpriced industries in this review.
Since last month:
- P/E has improved in computers/peripherals, is stable in telecom, and deteriorated elsewhere.
- P/S is stable in wireless telecom, and deteriorated elsewhere.
- P/FCF has improved in wireless telecom, is stable in computers/peripherals, entertainment and communication equipment, and deteriorated elsewhere.
- ROE is stable in computers/peripherals and electronic equipment semiconductors, and deteriorated elsewhere.
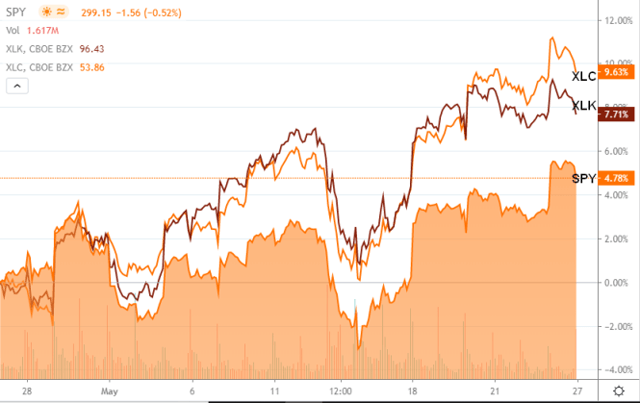
- The Technology Select Sector SPDR ETF (XLK) and the Communication Services Select Sector SPDR Fund (XLC) have outperformed the SPDR S&P 500 ETF (SPY) by about 3% and 4.8%.
- On this period, the 5 best performing S&P 500 technology or communication stocks are DISH Network Corp. (DISH), Fortinet Inc. (FTNT), News Corp. (NWSA), Paycom Software Inc. (PAYC), and ViacomCBS Inc. (VIAC).
Some cheap stocks in their industries
The stocks listed below are in the S&P 1500 index, cheaper than their respective industry factor for price/earnings, price/sales and price/free cash flow. The 10 companies with the highest return on equity are kept in the final selection. Quantitative Risk & Value Members have an early access to the stock lists before they are published in free articles. The list was published for subscribers at the beginning of the month based on data available at this time. This is not investment advice. Do your own research before buying.
| NCR | NCR Corp. | COMPUTER |
| AMAT | Applied Materials Inc. | SEMIANDEQUIP |
| INTC | Intel Corp. | SEMIANDEQUIP |
| ORCL | Oracle Corp. | SOFTW |
| ADS | Alliance Data Systems Corp. | TECHSVCE |
| CSGS | CSG Systems International Inc. | TECHSVCE |
| IBM | International Business Machines Corp. | TECHSVCE |
| TTEC | TTEC Holdings Inc. | TECHSVCE |
| AMCX | AMC Networks Inc. | MEDIA |
| IPG | Interpublic Group of Cos. Inc. | MEDIA |
Detail of valuation and quality indicators in technology and telecommunication on 5/26/2020
I take 4 aggregate industry factors: price/earnings (P/E), price to sales (P/S), price to free cash flow (P/FCF), and return on equity (ROE). My choice has been justified here and here. Their calculation aims at limiting the influence of outliers and large caps. They are reference values for stock picking, not for capital-weighted indices.
For each factor, I calculate the difference with its own historical average: to the average for valuation ratios, from the average for ROE, so that the higher is always the better. The difference is measured in percentage for valuation ratios, not for ROE (already in percentage).
The next table reports the 4 industry factors. There are 3 columns for each factor: the current value, the average (“Avg”) between January 1999 and October 2015 taken as an arbitrary reference of fair valuation, and the difference explained above (“D-xxx”).
| P/E | Avg | D- P/E | P/S | Avg | D- P/S | P/FCF | Avg | D- P/FCF | ROE | Avg | D-ROE | |
| Computers/ Peripherals | 16.96 | 24.67 | 31.27% | 0.85 | 1.24 | 31.12% | 22.12 | 21.68 | -2.04% | -1.55 | -8.33 | 6.78 |
| Wireless Telecom | 24.30 | 27.57 | 11.87% | 1.18 | 1.75 | 32.72% | 34.42 | 31 | -11.02% | 2.09 | -14.25 | 16.34 |
| Communication Equipt | 45.09 | 28.48 | -58.31% | 1.55 | 1.61 | 3.61% | 22.02 | 24.1 | 8.64% | -8.21 | -9.61 | 1.40 |
| Entertainment | 45.13 | 23.46 | -92.36% | 3.17 | 1.54 | -105.69% | 22.34 | 19.9 | -12.26% | -15.24 | -3.21 | -12.03 |
| Electronic Equipment | 21.51 | 21.26 | -1.18% | 1.37 | 1.3 | -5.20% | 25.16 | 21.35 | -17.84% | 2.36 | -1.77 | 4.13 |
| Software | 54.78 | 33.79 | -62.12% | 5.84 | 2.81 | -107.73% | 49.47 | 23.95 | -106.54% | -21.39 | -8.17 | -13.22 |
| Diversified Telecom | 28.38 | 19.95 | -42.25% | 1.81 | 1.2 | -51.22% | 19.02 | 23.83 | 20.19% | -1.91 | -11.97 | 10.07 |
| Semiconductors* | 38.62 | 31.77 | -21.57% | 3.68 | 2.41 | -52.81% | 37.62 | 28.86 | -30.36% | 2.74 | -1.34 | 4.08 |
| IT Services | 29.95 | 24.11 | -24.22% | 2.42 | 1.18 | -104.88% | 24.94 | 20.23 | -23.28% | 3.69 | 2.86 | 0.83 |
* Averages since 2003
Two industries are not in the table: media (GICS code 502010) and interactive media and services (GICS code 502030). The moving parts in these industries make it difficult to set historical baselines for our metrics due to GICS evolution.
The following charts give an idea of the current status of 3 valuation factors (P/E, P/S, P/FCF) and a quality factor (ROE) relative to their historical average in each industry. For all factors, the difference to average is calculated in the direction where positive is good. For valuation ratios, lower is better; for ROE, higher is better. On the charts below, higher is always better.
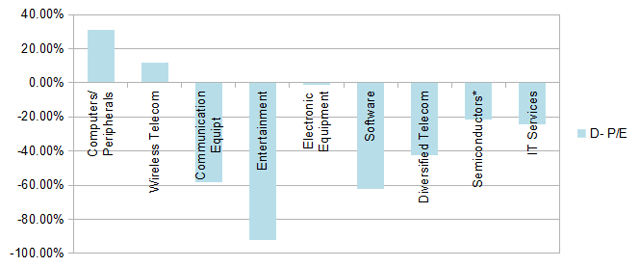
Price/earnings relative to historical average:

Computers/Peripherals are about 30% underpriced regarding their historical average in price/earnings ratio.
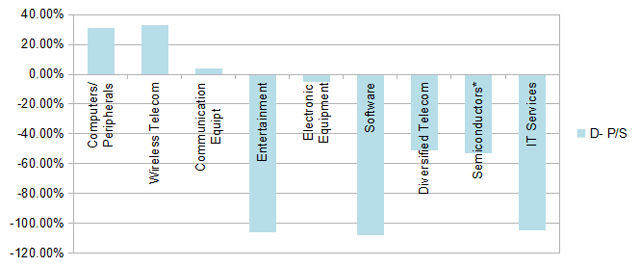
Price/sales relative to historical average:

Computers/Peripherals and wireless telecom are about 30% underpriced regarding their historical average in price/sales.
Price/free cash flow relative to historical average:

Diversified telecom is about 20% underpriced regarding the historical baseline in price to free cash flow.
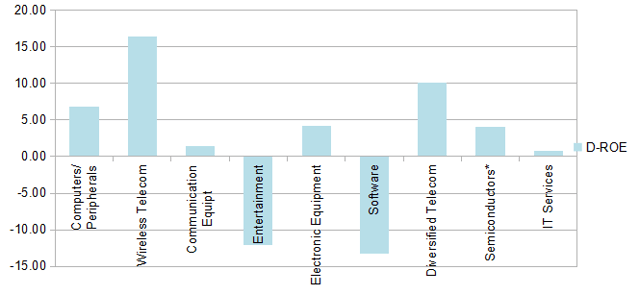
ROE relative to historical average:

Entertainment and software are not only overpriced; they are also significantly below their historical profitability baseline.
Momentum
The next chart compares the price action of XLK and XLC with the benchmark in 1 trailing month.

Chart by TradingView
Most of my stock holdings are based on quantitative value models. However, value is a bad timing indicator. Quantitative Risk & Value (QRV) provides you with a more realistic quantitative approach, for a world of probabilities instead of just risk on/risk off. It includes a systemic risk indicator and strategies based on it. Get started with a two-week free trial and see how QRV can improve your investing decisions.
Disclosure: I am/we are long INTC. I wrote this article myself, and it expresses my own opinions. I am not receiving compensation for it (other than from Seeking Alpha). I have no business relationship with any company whose stock is mentioned in this article.