PNM Resources, Inc.: Running In Place With A Heavy Burden
by Amr BennisSummary
- PNM is currently fairly valued to 22% overvalued depending on approach.
- PNM's financial health and solvency is a major point of concern.
- Further market volatility could lead to more downside.
At $38-$40 per share, PNM Resources, Inc. (PNM) is relatively fairly to overvalued. However, investors should pay close attention to the company's solvency position, high debt-to-equity ratio, and low dividend coverage ratio before investing. Further market volatility may result in further downside over the next 6-9 months.
Background
PNM operates in the Regulated Electric Utilities industry through its two subsidiaries, Public Service Company of New Mexico (PNM) and Texas-New Mexico Power Company (TNMP). It is primarily involved in the retail electricity generation, transmission, and distribution in Texas and New Mexico, although it also engages in some other holding company activities such as leasing of office space, vehicles, and real estate.
Fundamentals
I'll cut to the chase: PNM's financial health isn't pretty. In fact, it hasn't been for a while. But you'd be forgiven for not noticing it; the stock witnessed a stellar run in 2019 right up until the market melt-down of 2020:
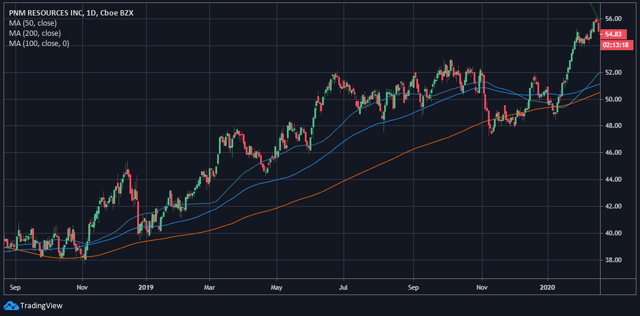
(Source: TradingView. Author's chart)
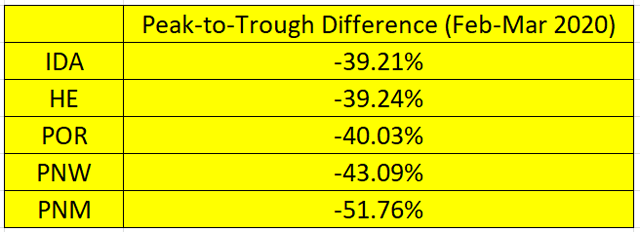
Of course, once the market crashed in February, PNM went down along with almost all others. But, taking a closer look at PNM and some of its peers in the Regulated Electric industry shows that it was hit the worst in its sub-group.
(Sub-group includes IDACORP, Inc. (IDA), Hawaiian Electric Industries, Inc. (HE), Portland General Electric Company (POR), and Pinnacle West Capital Corporation (PNW))
For context, here's how the sub-group performed:
(Source: Table created by author with data from TradingView)
There was a 3.88% difference in the drop between the best performing stock and the fourth best, while there was an 8.67% difference between the fourth best stock and the last, PNM. I believe the reason why PNM dropped harder than most is because of underlying fundamental financial issues with the company.
I conducted financial analysis on PNM and found that it scored lowest (or near-lowest) on 13 out of 14 different metrics. I compared PNM to the Regulated Electric industry averages as well as to averages of the sub-industry group of companies with a market cap below $10bn (mid-cap) and gave it a ranking for each metric within the sub-industry group.
Let's start with profitability ratios:

(Source: Table created by author with data from YCharts)
PNM only outperformed the industry and its peer group on one metric, its gross margins, and in fact scored 2nd out of its five peers. However, all other profitability ratios are quite bleak, to say the least. Not only did PNM significantly underperform for each profitability metric, it also scored dead-last within its sub-group.
When it came to liquidity, it didn't get any better; PNM scored dead last in its sub-group and significantly below both averages calculated for the Current and Quick Ratios:

(Source: Table created by author with data from YCharts)
The next logical step here is solvency. And again, PNM scored dead last:

(Source: Table created by author with data from YCharts)
However, the solvency position is what concerns me the most about PNM compared to the profitability and liquidity positions. At a time when we're starting to see major companies in the US file Chapter 11 in the fallout of the economic shutdown, having a poor solvency position is nothing to aim for.
PNM has 1.5x the industry's average debt/equity ratio, and more than 2x the debt/equity ratio for its sub-group peers. In the long term, it also has a significantly worse debt/EBITDA ratio, and in the short term, a very poor interest coverage ratio of merely 1.42x. If we take it a step further and apply the Altman Z-Score for non-manufacturers, we find that PNM actually scores negative on the model. I added the KZ-Index in after I saw the Altman Z-Score, although it should be noted that the KZ-Index is merely a probabilistic model, but I believe it helps to take a look at it in this case especially when comparing PNM to its industry. However, I am not as concerned with its absolute score or its score relative to the industry as I am with its score relative to its sub-group, as there are in fact other companies with similar KZ-Index scores, but they have much, much higher market caps, while PNM is the smallest company in the mid-cap sub-group.
Moody's rating for PNM certainly reflects its solvency position:
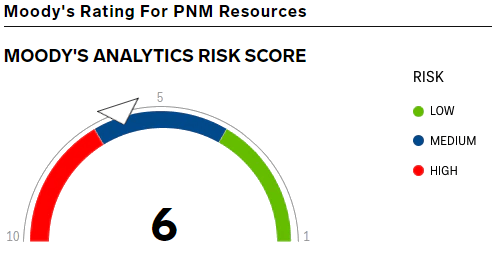
But why exactly is PNM having a rough solvency position? I believe the answer lies in their CAPEX spending:

(Source: Table created by author with data from YCharts)
The table above ranks PNM in terms of its CAPEX to Revenue ratio compared to 22 other companies in the Regulated Electric industry. Despite PNM being the smallest company in market cap out of the 22 companies, it has consistently spent more on CAPEX in the past five years (in relation to its revenues). With the utilities sector being a capital-intensive one, it might seem on first glance that PNM has been investing heavily in its future and operations as any utility company should. It could also be argued that it should be commended on putting this much focus in its CAPEX. I would agree, except that over the past 10 years, that CAPEX hasn't materially translated.
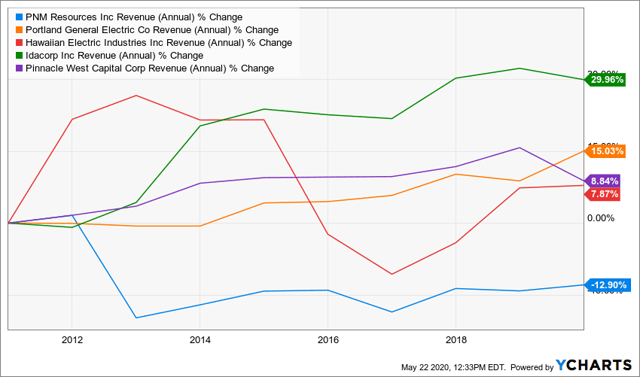
To illustrate this, let's start by looking at PNM's top-line performance over the past 10 years in comparison to its sub-group peers:
(Source: YCharts)
As illustrated by the chart above, PNM is the only company in the sub-group that has, over the past 10 years, had a negative revenue growth. In fact, it appears that PNM suffered a big hit in 2013 and has struggled to recover ever since - compare it, for example, to PNW, where they had an almost identical annual revenue % change by 2012.
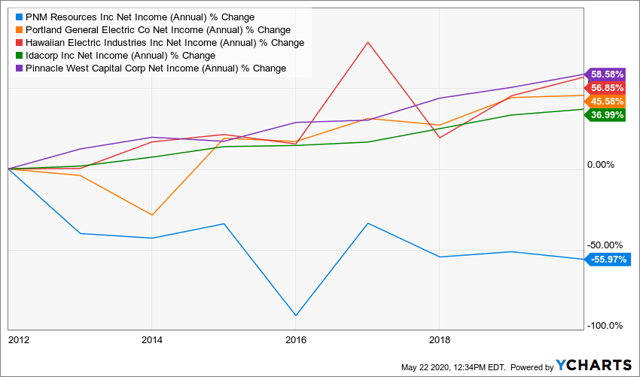
Perhaps then CAPEX spending translated into bottom-line growth? Again, not really. In fact, it's a much worse looking picture for PNM's bottom-line:
(Source: YCharts)
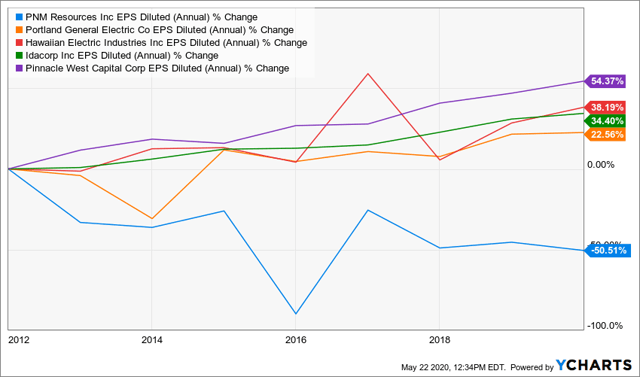
EPS, then? Guess again:
(Source: YCharts)
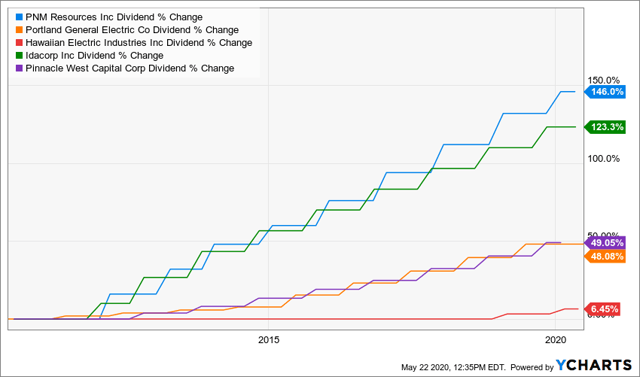
So now we have a picture of PNM, investing heavily in CAPEX relative to its revenues and its size compared to its peers (and borrowing heavily to do so), and failing to translate that CAPEX into top-line or bottom-line performance improvement. We could potentially now attribute this to the fact that PNM operates in a heavily-regulated industry; let's face it, someone has to keep the lights on, correct?
That's true. But here's the part that really doesn't make sense: PNM's annual dividend % growth has significantly outperformed the same peers that outperformed it on every other metric discussed so far over the past 10 years:
(Source: YCharts)
And now we come to the final punch-in-the-gut: PNM's dividend coverage ratio is currently less than 1x at 0.46x, compared to an industry average of 1.48x and a sub-group average of 1.6x:

(Source: Table created by author with data from YCharts)
I'll close this financial analysis by stating that it's not that I believe that PNM will go bankrupt; that would be a highly doubtful scenario given its long history and its defensive sector's necessity in the country at the moment. My point is simply that PNM's financial position is not attractive by any means, and may be in fact the worst position in the entire sector (pending further analysis of PG&E Corporation (PCG) and OGE Energy Corp. (OGE)).
A Note on Financial Calculations
All industry average calculations/rankings exclude PCG and OGE. These two companies' financial health (at first glance) indicated that they might be in the same boat as PNM, and their inclusion in calculations would have skewed the results too far for my liking.
Some of the industry average calculations (but not rankings) also excluded one company which was a positively significant outlier with regard to a few financial metrics: HE. HE's financial health (at first glance) indicated that it might be in a much better position than its peers, and its inclusion in some calculations would have positively skewed some of the corresponding results too far, painting a slightly less accurate picture.
I express no particular opinion on PCG, OGE, or HE in this article, merely expressing that I have made some exclusions from my calculations and explaining the reasons behind these exclusions.
Valuation
Despite the bleak financial picture I painted for PNM in this article, I believe that it is actually fairly valued using a multiples-based relative valuation approach, with a relative valuation closer to $38-$40. However, this is based on P/B and P/S multiples, as the P/E picture is more complicated.
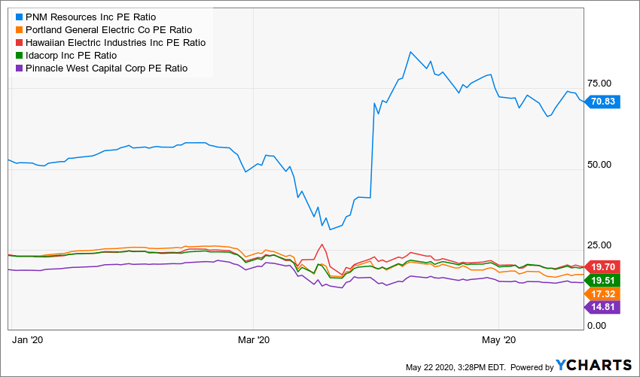
PNM has, for the most part, always traded at an elevated P/E ratio compared to its peers. However, its P/E ratio shot up above its pre-crash level towards the end of March.
(Source: YCharts)
Running a P/E valuation relative to the industry or sub-group yields a valuation of about $11 which I believe would be quite outlandish especially given that such a valuation is, naturally, relative. So, a more reasonable approach if we really want to consider a P/E valuation would be to consider its P/E pre-crash which was about 58.10x. At that P/E, PNM reaches a valuation of about $31.38, meaning it's about 22% overvalued.
I usually run a DCF valuation on companies I analyze, however in the case of PNM I have chosen not to do so. In a DCF valuation, one is faced with the task of making several assumptions about the future of the company, and PNM's future is currently opaque enough for me to recognize a DCF valuation's significantly limited value in this instance.
Investment Action
If we stick with a P/B and P/S relative valuation, we find that PNM is nearly fairly valued, with no clear catalysts in the near future to drive its price in either direction beyond market volatility.
If we choose to stick to P/E, however, and the 22% overvaluation it implies, then I believe some use of technical analysis of PNM might be helpful. Here's PNM chart as of the time of writing:
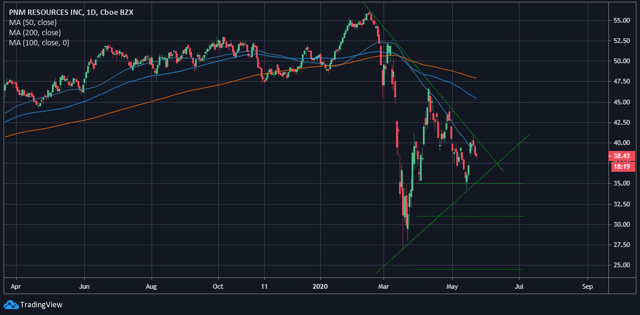
(Source: TradingView. Author's chart)
As we can see from the chart, PNM has not broken the downtrend it started in the market meltdown, and it has struggled to definitively break above the 50-day MA. However, I have identified three key historical support levels for PNM: $35, $31, and $24.50, with $31 being the closest to the implied P/E-based valuation we calculated.
Two things could lead the price to fall back to any of these levels: market volatility, and a "the bill comes due" moment for PNM. With that being said, I wouldn't hold my breath for the second scenario. My ultimate stance on PNM then would be that if I would include it in a utilities portfolio, I'd wait to see how the market volatility develops over the course of the year and watch PNM's price reaction to it.
Risk Factors to Thesis
I have identified two factors that may push PNM's price upward despite all of the factors discussed above. The first is a simple rotation into Utilities as a defensive sector during the recession pulling up all stocks in the sector. The second is PNM's plans to file for a full decoupling mechanism for residential and small commercial customers to begin in 2021 in lieu of a general rate case. This would in theory better align PNM's rates with its fixed costs and might allow for better recovery of those fixed costs which should then lead to a better bottom-line. I have found it difficult to estimate the full effect of a possible decoupling particularly as it does not seem (so far) to include larger commercial and industrial customers, as well as a lack of guidance on this matter from management. However, as I mentioned, any potential upside from this would be realized in 2021 at the earliest.
Author Bias
I'm inherently biased in favor of DCF intrinsic valuation over relative valuation. The difficulty in constructing a fair intrinsic valuation for PNM may have negatively influenced my overall opinion of the company. I'm also currently bearish on the market, overall. I also believe that the current recession will drive equities, overall, closer to their intrinsic value over the next 3-6 months.
Conclusion
I believe PNM is facing a mounting solvency issue caused by high CAPEX spending relative to its revenues and market cap with very poor return on investment over the past years. Its relative valuation varies from fairly valued to 22% overvalued depending on approach, and market volatility may drive its prices lower to its historic technical price support level over the long term if its CAPEX continues to fail to yield positive results and if its approach to a decoupling mechanism proves to be ineffective in the medium-term in improving its financial position. Its poor solvency situation and low dividend coverage ratio coupled with lower-than-average dividend yield dismiss it as a potential valuable addition to a Utility portfolio.
Disclosure: I/we have no positions in any stocks mentioned, and no plans to initiate any positions within the next 72 hours. I wrote this article myself, and it expresses my own opinions. I am not receiving compensation for it (other than from Seeking Alpha). I have no business relationship with any company whose stock is mentioned in this article.
Additional disclosure: This writing is for informational purposes only. It does not constitute an offer to sell, a solicitation to buy, or a recommendation regarding any securities transaction. It also does not offer to provide advisory or other services in any jurisdiction. The information contained in this writing should not be construed as financial or investment advice on any subject matter. I expressly disclaim all liability in respect to actions taken based on any or all of the information on this writing.