Improving EIA's Weekly Crude Oil Production Estimate
by Robert BoslegoSummary
- Each week the EIA estimates crude production and an adjustment.
- I used regression of the weekly figures to the monthly actual production.
- The process developed a more accurate estimation of weekly crude production.
- The EIA statistics department should add the procedure to their weekly estimation process.
- The process is not simply adding the adjustment to the weekly production estimate.

Each week, the Energy Information Administration (“EIA”) releases the Weekly Petroleum Status Report (“WPSR”). Within the report on line 1 is an estimate of domestic crude oil production. This estimate is primarily model-driven and is not a survey of U.S. producers.
The crude oil balance is a product of imports (line 5), exports (line 9), crude oil inputs to refineries (line 14), and crude oil stock change (line 10). Crude oil stocks are the product of a survey and are therefore inherently more accurate than the EIA’s estimate of crude production. The imports and export figures are based on estimates provided by U.S. Customs. Estimates of imports and exports based on tanker movements are often wrong since they cannot tell what data was reported to customs.
When the EIA adds up production and imports and subtracts exports, refinery inputs, there is usually a difference between the estimate stock change and the stock change from the weekly stocks survey. That error is reported as an “Adjustment” in line 13, previously called the Balancing Item.
Every month, the EIA also provides a monthly estimate of crude production in its E!A-914 report. That estimate is the result of a survey and data at the state level. The is the figure that is assumed to be “actual,” though it may be revised slightly as the months go by when more accurate data is reported.
There have been at times large discrepancies between the weekly estimated production and the monthly actual production. Attempts to derive a more accurate weekly level have added the adjustment to the production level, assuming the adjustment was the result of an error in the production estimate.
But an analysis of the differences between estimated and actual production v. the production + adjustment and actual production reveals that the latter produces a less accurate estimate of actual production than estimated production.
For example, for the period 2015 through 2019, the difference between actual production and estimated production averaged -38,000 b/d and the standard deviation of those differences was 193,000 b/d.
The average difference between actual production and estimate production + adjustment was -185,000 b/d and the standard deviation of those differences was 249,000 b/d.
There have been many articles about the weekly production estimate and what the adjustment means or implies on Seeking Alpha. I was asked how to interpret the adjustmentor balancing item to obtain a better estimate of actual production from the weekly estimates.
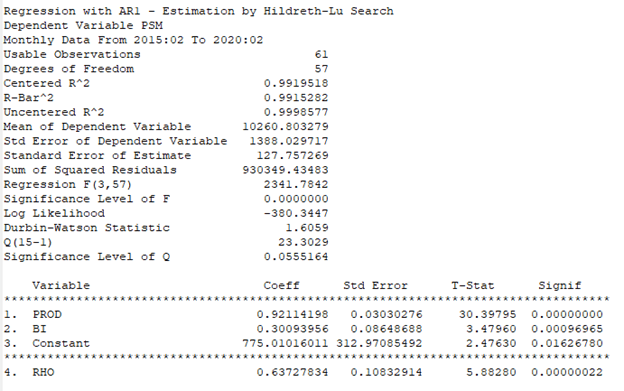
I interpolated the weekly into monthly values and performed a regression of the actual production (“PSM”) as the dependent variable and weekly production and balancing item as the independent variables.
The output of the regression is copied below and the statistics show an r^2 of 99+% using an auto-regressive method.

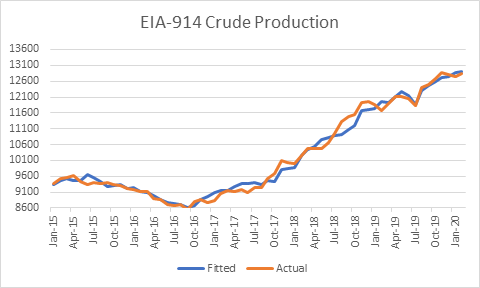
A graph of the actual v. fitted values is depicted below. The average difference is 5,000 b/d and the standard deviation of the differences is 162,000 b/d. This equation is far superior to using estimated production plus the adjustment.

For March and April EIA-914 values (which have not yet been released), the equation predicts values of 12.828 and 12.064 million barrels per day.]
Conclusions
Using regression, the best fit for actual production was found based on weekly estimated production and the adjustment. The best linear fit was not the sum of production plus the adjustment. Using the balancing item was statistically significant in the regression because the T-stat was over 2.0.
The EIA statistics department should apply the above procedure to the weekly production estimating process to get a more accurate estimate of production. But they probably won't, so I'll post it to the members of my service in SA Marketplace.
Are you pleased with your energy sector returns?
To guide investors who are interested in profiting from outstanding opportunities in the energy sector, I provide a service on Seeking Alpha’s Marketplace oriented toward individual investors, Boslego Risk Services. A long/short Model portfolio is continuously updated, along with on-going analysis of the oil market.
I am now accepting new members to Boslego Risk Services and invite you to sign-up. There are monthly and annual pricing options as described here. You may also read reviews posted by members here.
NEW: FACT-CHECKING SERIES: FALSE CLAIMS REVEALED TO MEMBERS ONLY.
Disclosure: I/we have no positions in any stocks mentioned, and no plans to initiate any positions within the next 72 hours. I wrote this article myself, and it expresses my own opinions. I am not receiving compensation for it (other than from Seeking Alpha). I have no business relationship with any company whose stock is mentioned in this article.