Holding the World’s Breath at 11,135 Feet
by Brian KahnThere are just a few moments from my past that, having left an indelible mark on my life, I can now return to in an instant. My first dance at my wedding to “I Only Have Eyes for You.” The phone call I received, as I dressed to go to work, telling me my mother had died. Opening my college acceptance letter with a crisp rip of the envelope.
These are life-altering highs and lows. When Aidan Colton – a research scientist I had met for the first time just hours earlier – handed me a glass globe encased in tape, that simple exchange became another one of those memories. It may seem odd that a stranger could affect me so deeply, but what Colton handed me was more than a trinket. It was a flask filled with the very peculiar time we live in, heavy as all of human history. Standing there in the searing sun on the side of a volcano, I held everything for a brief moment.
The Mauna Loa Observatory, located smack in the centre of the island of Hawaii, is one of the most hallowed places in science. Researchers there measure a variety of gases in the atmosphere, but none more important than carbon dioxide. As we enter a crucial decade in human history, the data collected in glass flasks at Mauna Loa is more than just numbers in a logbook: it’s a record of human success – or failure.
While I’m not inclined to mysticism, I find it hard not to feel deep reverence for Mauna Loa Observatory and the Keeling Curve, the record that made it famous. When I reached out to see if I could visit, I expected to have to jump through a million hoops. Instead, I just filled out a simple Google Form and exchanged a couple emails with Colton, who provided directions for the drive from the seaside town of Hilo to the observatory sited at 11,135 feet above sea level. I set out at the crack of dawn, winding my way through verdant tropical forests into the blackened moonscape of Mauna Loa. My wife, a fellow climate nerd, came along for the ride.
The Keeling Curve, which Colton works on at the observatory, is part of the bedrock of climate science. Charles Keeling, a Scripps researcher and the curve’s eponymous creator, began taking carbon dioxide measurements on the flanks of Mauna Loa in 1958. Sitting in the middle of the Pacific Ocean and swept clean by trade winds, Mauna Loa is one of just a handful of places on Earth where it’s possible to capture a clear snapshot of the atmosphere. Here, scientists can track carbon dioxide in measurements of parts per million.
The daily measurements were initially meant to track the Earth’s breathing patterns as plants bloom and suck up carbon dioxide in the spring and summer and then die and decompose, releasing carbon dioxide back into the atmosphere in fall and winter. But as the record grew, it became clear that the Earth wasn’t breathing normally. It was being choked by increasing carbon dioxide from human activities. Nearly two-thirds of all carbon pollution has been dumped into the atmosphere since I was born in 1981.
The Keeling Curve is the single clearest indicator of the stress humans have put on the planet. In 2015, it was dubbed a national landmark by the American Chemical Society. It’s made appearances in congressional testimony, it showed up in Al Gore’s An Inconvenient Truth, and it’s regularly in the news, particularly at this time of year, because May is the month of peak carbon dioxide. As long as human activities keep emitting the gas, every year is bound to see a new made-for-the-headlines record.
The threat implied by the curve’s jagged, rising seesaw isn’t specifically what drew me to climate science. Instead, it was something far more mundane and personal: I was a ski bum worried about snow disappearing. But in the years since, I haven’t been able to shake the urge to visit the site of Keeling’s work.
Part of it was a nerdy interest in science history akin the draw of Bunker Hill for a Revolutionary War buff, but there was also a desire to feel something. The world’s unfettered carbon dioxide emissions have ushered in an era of great unravelling. Still, this unprecedented global event can feel strangely remote, the big picture always just out of view.

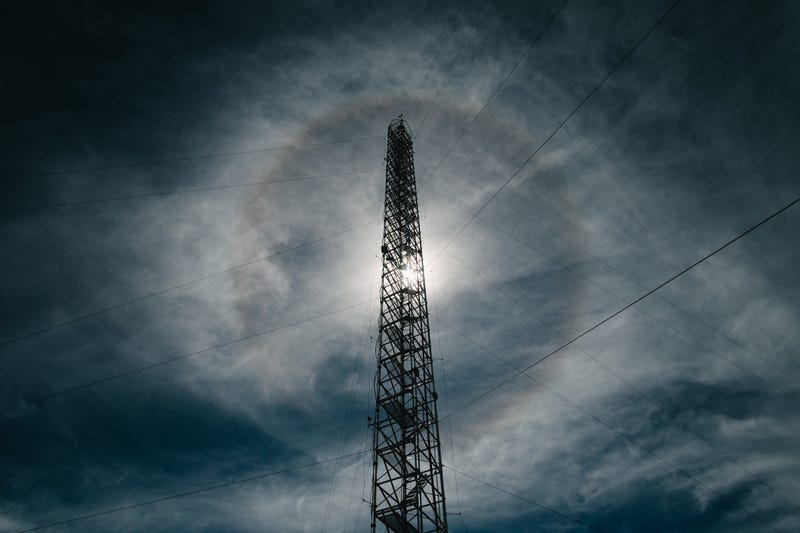
A tower at Mauna Loa Observatory that samples various atmospheric gases.
Carbon dioxide is invisible. The atmosphere is everywhere. Mass extinction, collapsing ice, and acidifying seas are consequences we all must live with, but as concepts, they’re difficult to grasp. While I cover these topics every day and live in the same era as everyone else, climate change remained maddeningly distant.
Visiting Mauna Loa Observatory felt like a chance to, at least briefly, take everything in. The observatory is now run by the National Oceanic and Atmospheric Administration, which is the agency Colton works for. Colton himself is up at the observatory roughly three days a week. Every morning he’s there, he goes to the same spot on the outskirts of the facility battered by searing UV rays (and the occasional tropical snowstorm) to take the day’s measurements.
The day I was there was a typical one for Colton or any of the other researchers who contribute to keeping the record. First, he pulled a briefcase-like kit from the trunk of a government SUV. Opening the briefcase, he then deployed an antenna with a tube that snaked up it to collect the first sample. Next, he flipped a switch and walked away, allowing the flasks inside to fill with rarified air. The sample would later be analysed on-site and added to the NOAA record. (On that day, the carbon dioxide concentration was 409.1 parts per million.)

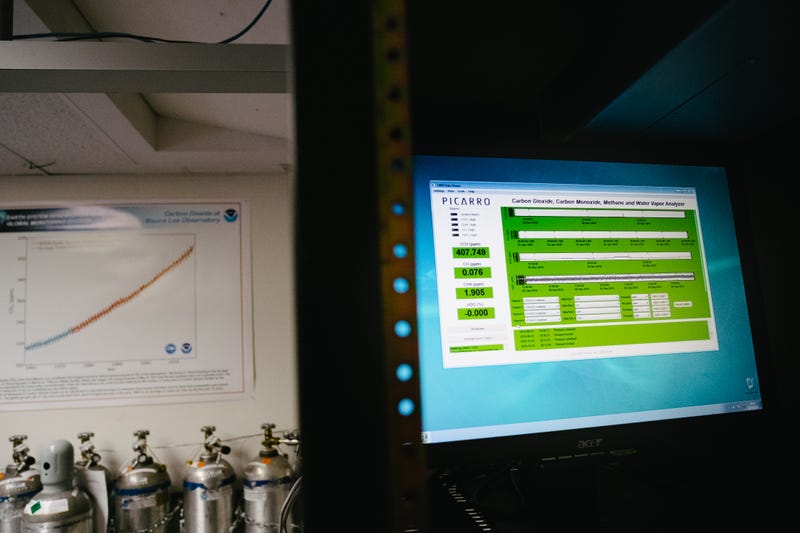
Picarro software analyzes carbon dioxide concentrations in a sample at Mauna Loa Observatory. The NOAA carbon dioxide record is visible in the background.
The Keeling Curve measurements are made using a different set of containers. Colton reached into the back of SUV again, pulling out the first of two vacuum-sealed glass spheres covered in tape. The tape blocks out the sun, which can cause changes to the gases once they’re sucked into the flasks, and also keeps them from shattering into a million un-gatherable pieces if the sphere implodes. These are the same type of flasks Charles Keeling used.
Unlike the first, semi-automated sampling process, this measurement is taken using some old school science. Colton had to walk to an open space and plunge a small opening in the flask that broke the seal, sucking in air. Because humans exhale carbon dioxide, he held his breath before and after breaking the seal, which is no small feat at 11,135 feet. Once capped, the sample is sent back to the mainland for analysis, another small point in the menacing sawtooth of the Keeling Curve.
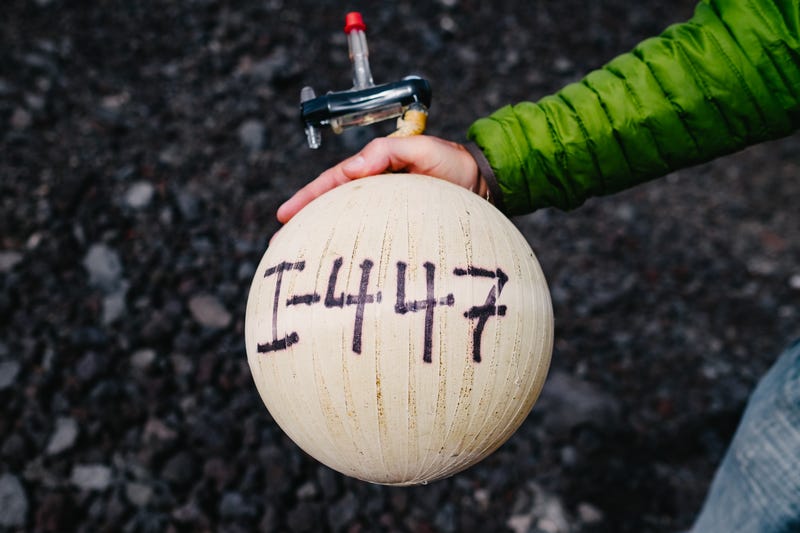
Watching Colton sample the sky made the Keeling Curve feel more concrete and the global climate in general more tangible. I asked the researcher if I could photograph him holding the flask, it’s round shape and white tape contrasting sharply with the busted, black lava rock. He kindly obliged.

A glass globe holding that day’s Keeling Curve measurement.
He then asked if I wanted to hold the sample. To tell the truth, I have held babies with less anxiety than I felt as he handed me the glass orb. Like a new driver with their fingers glued at 10 and 2, I kept both hands on the flask at all times. Tactilely, it was like an over-inflated volleyball. The tape felt soft from months, maybe years, of being handled as samples were taken, packed and shipped across the Pacific, emptied and analysed, and the flask was sent back to Hawaii for reuse.
It may not have looked like much, but I was gripping much more than just a worn piece of lab equipment between my fingers. All the world’s efforts were trapped inside this tiny globe. Here in my hands were Exxon’s lies, a million climate strikers’ pleas, me and my flight across the Pacific. Here was the fate of the West Antarctic ice sheet, the fate of koalas, the fate of farmers in India.
Here was a scale, one that humans – particularly a small subset of wealthy ones with carbon-intensive lifestyles – have pressed a heavy thumb on. That’s thrown things off-balance, but there’s time to lift the weight before the scale topples completely.
I’ve written about all of this for years, but holding the daily measurement of the Keeling Curve was the closest I’ve ever felt to the climate I cover. After taking the flask back, Colton offered to let my wife and I “sample” the air. Like he’s done with countless school groups who have toured the observatory before, Colton gave us tiny vials to hold up into the wind to gather our own little pieces of human history. Scientifically, this was a bit like panning for gold at a tourist stop in an old mining town, but we gladly accepted. My wife laughed at the absurdity of it, two adults holding glass tubes tilted above their heads like kids on a class trip. I still held my breath.

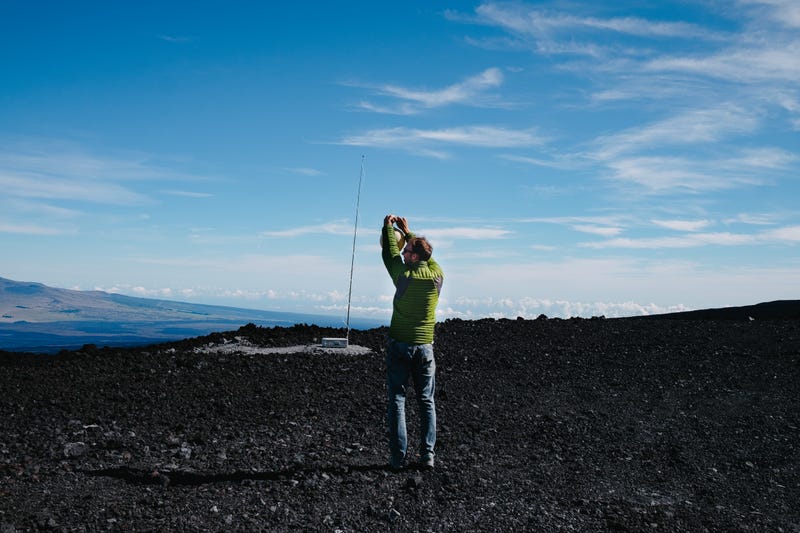
Aidan Colton holds his breath as he takes one of two Keeling Curve samples for the day. The day’s NOAA sampling equipment is visible in the background.
All images: Brian Kahn (G/O Media)