The Relationship Between Short-Term And Mid-Term Volatility
by Adam SmigaSummary
- Short and mid-term volatility mostly move in the same direction but with different dynamics.
- Short-term volatility ETPs suffer from larger price erosion than mid-term ETPs.
- The relationship between short and mid-term volatility is relatively predictable in normal market conditions.
In my first article I mentioned that it’s possible to use mid-term volatility to hedge positions in short-term volatility. It means that you can hedge your exposure to VXX, VIXY or UVXY with VXZ or VIXM.
Today I’d like to explore the relationship between short and mid-term volatility more in depth. To analyze the relationship I’ll statistically evaluate the historical data of index SPVIXSTR and SPVIXMTR. These two indexes serve as underlyings for the most short and mid-term volatility ETPs. I am using these two indexes because there are some issues with historical data of particular ETPs. However, VXX, VIXY, VXZ and VIXM are effective in tracking its underlying index so directly using the underlyings shouldn’t significantly affect the results.
Understanding the short-term and mid-term volatility indexes
To deeply understand the relationship between short and mid-term volatility it’s necessary to understand how these two indexes are composed.
In the factsheet of SPVIXSTR index is following definition: "The S&P 500 VIX Short-Term Futures Index utilizes prices of the next two near-term VIX futures contracts to replicate a position that rolls the nearest month VIX futures to the next month on a daily basis in equal fractional amounts. This results in a constant one-month rolling long position in first and second month VIX futures contracts."
The similar definition is available for SPVIXMTR: "The S&P 500 VIX Mid-Term Futures Index measures the return of a daily rolling long position in the fourth, fifth, sixth and seventh month VIX futures contracts. It is a member of the S&P 500 VIX Futures Index Series which offers investors directional exposure to volatility through publicly traded futures markets."
The key difference is that the SPVIXSTR index is composed of two near-term VIX futures contracts while the SPVIXMTR simulates the exposure to 4th, 5th, 6th and 7th VIX futures. It’s essential because the mid-term futures do not suffer from so large price erosion as short-term futures over the long term. It's caused by the strength of contango between near-term futures contracts. Below you can see contango histograms that show contango between the 1st and 2nd (blue histogram) and the 5th and 6th (yellow histogram) VX futures. As you can see, contango between 5th and 6th contract is on average 3 % and it's relatively stable. On the other hand, contango between near-term futures has higher average, approximately 8 % and it also has higher variability.

Source: Spreadcharts.com
This behaviour of mid-term volatility could become a basis for building more complex strategy. Such strategy would use VXX or VIXY to short volatility and long position in mid-term volatility ETPs VXZ or VIXM would be used as a hedge. The strategy should be profitable thanks to the faster value decay on short-term ETPs than on mid-term ones.
Understanding the dynamics of short-term and mid-term volatility
To properly hedge the exposure to short-term volatility with mid-term volatility it’s necessary to know how these two interact. Therefore, I'll analyze the relationship between SPVIXSTR and SPVIXMTR using regression.
The picture below shows the results. As an input data for this model the daily percentage changes were used. The coefficient for SPVIXSTR is 0.44. This coefficient tells us that one percentage point change in SPVIXSTR price will cause the SPVIXMTR to move 0.44 percent in the same direction. R-squared value means that 84 % of SPVIXMTR variability can be explained with changes in SPVIXSTR. It proves there is a strong relationship between these two indexes.

Source: Own proceding of spindices.com data
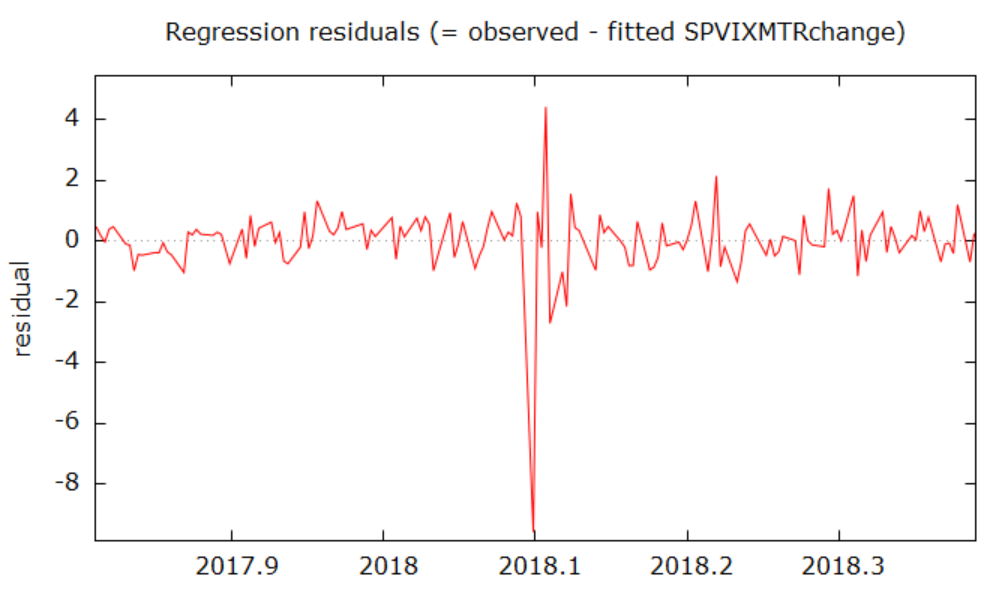
In the chart below residuals of the regression (the differences between observed and predicted values) are shown. As you can see, model has relatively good predictive power in times of low volatility but in hectic times residuals are increasing which means the model is less effective in predicting values. If you look at the chart, you can see there are two periods with huge residuals. The first one is February 2018 and the second is February and March this year. These two periods were times of huge spikes in volatility and I think they should be analyzed more. Therefore, I'll take a closer look at them now.

Source: spindices.com
The detailed view at the situation in 2018 is in the chart below. Its obvious that the mid-term volatility didn't react as predicted by model but the reaction was milder. It reacted by almost 10 % less than the model predicted. On the other hand, three days later it overreacted by 4 %.

The next chart shows the residuals during spikes in February and March of this year. As you can see, the reaction was also significantly different than the model predicted.

Source: spindices.com
These two situations show it's hard to predict the relationship between SPVIXSTR and SPVIXMTR in extreme market conditions. The main finding nevertheless is that the relationship between short and mid-term volatility is positive and relatively predictable for the most of the time.
Conclusion
In the first part of the article I described costs of contango using contango histograms of short-term and mid-term VIX futures and I also proved that short-term ETPs suffer from faster value decay. In the second part, the relationship between SPVIXSTR and SPVIXMTR was analyzed. At the end I also demonstrated that the relationship can vary sometimes but it's mostly positive.
This article should serve as an introduction to volatility pairs trading. I'll write next article, where I'll be already more specific about the strategy for trading these pairs. I'm also curious about your trading strategies for volatility ETPs so let me know in comments.
Disclosure: I am/we are short UVXY. I wrote this article myself, and it expresses my own opinions. I am not receiving compensation for it (other than from Seeking Alpha). I have no business relationship with any company whose stock is mentioned in this article.