A Much Higher Gold Price Is No Flight of Fancy
This is how the price of gold could reach $60,000
In today’s Smart Money let’s take a break from our typical stock market analysis to embark on a flight of fancy related to the gold price and gold stocks.

Our journey will not target any particular destination. It’ll be more like a helicopter tour around a Hawaiian island. But rather than hover close to the mist of a cascading waterfall, we’ll cruise along the top of a rising gold market — both to look back at where it has been … and to gaze out in the distance to where it might go.
So sit back, relax, and enjoy this adventure to a magical place we’ll call: Gold $60,000.
As we begin our tour, we can see that part of the reason to buy gold stocks could be fading away. The worst of the novel coronavirus crisis seems to have passed, and the stock market has been recovering nicely.
So crisis-driven gold buying may subside somewhat, at least for a while. But as we will discover on today’s journey, the gold market listens to no one. And when it decides to rally, it is capable of spectacular gains … even when the stock market is also moving higher.
Furthermore, based on a strict monetary calculation, the gold price “deserves” to be selling for more than $60,000 an ounce!
Please … don’t call me crazy. I’m not forecasting a $60,000 gold price, just a much higher price than the current one around $1,700 an ounce. And remember, today’s Smart Money is just a flight of fancy.
So let’s get airborne.
A Golden ‘Buy’ Signal
About one year ago, I laid out a bullish case for gold in my newsletter, Fry’s Investment Report. As part of that analysis, I identified four specific factors that tend to produce a rising gold price.
One of those factors is negative interest rates, which we discussed here in Smart Money just a few days ago.
Another one of the four factors is something I called “just because.”
As I explained at the time:
“Financial markets don’t like extremes … at least not for a long time. For whatever reason, financial markets tend to ‘revert to the mean.’ They move away from valuation extremes back toward the middle — or mean — of their historic levels. This tendency is the ‘just because’ factor that sometimes causes lowly valued assets to rise in price, or richly valued assets to fall in price.”
All financial assets oscillate between extremes — from lows to highs, and back again. Gold is no different. But unlike most other financial assets, gold tends to zig higher when stocks are zagging lower. It is what professional investors call a “non-correlated asset,” as the nearby chart illustrates.

Each year in the chart shows the investment returns for the S&P 500 and gold during the preceding five years. Toward the right side of the chart, for example, we see years like 2008 and 2009 when the S&P 500 had produced losses during the previous five-year periods. By contrast, in those years, gold was showing sizable gains for the previous five years.
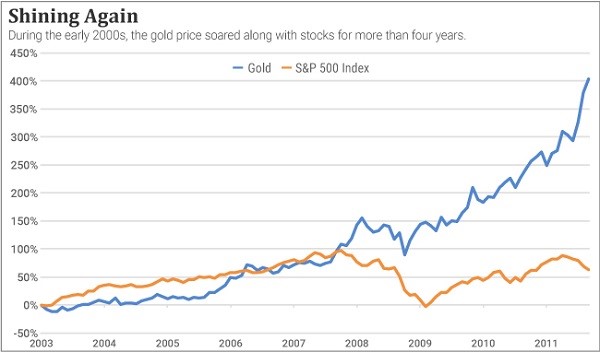
In fact, the S&P 500 didn’t merely deliver five-year losses in those years. It produced decade-long losses as well. During the 11-year span from August 2000 to August 2011, for example, the S&P 500 Index slumped more than 25%. Even after adding in dividends, the S&P 500 produced a loss of 8% during those fruitless years.
But gold soared nearly 600% during that time frame.
A Quiet Time for Gold Stocks
After 2011, however, gold took a backseat to the stock market once again. It slumped 45% over the ensuing four years, while the S&P 500 nearly doubled. These classic cyclical patterns demonstrate the inverse relationship between gold and stocks.
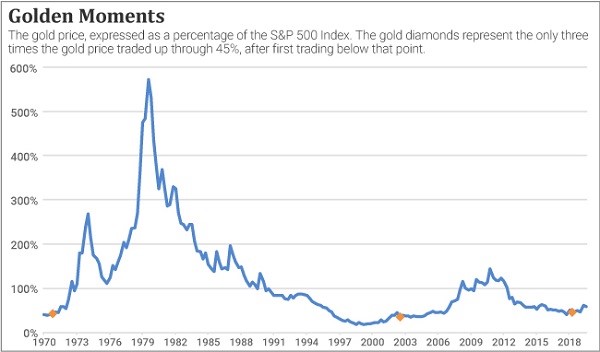
But this relationship reached an extreme in the fall of 2018. The price of gold, relative to the S&P 500, had reached its lowest level of the preceding 13 years.
From that point forward, the gold price has gained about 40%. Maybe this modest rally is “all she wrote” for gold. But history suggests otherwise.
If we examine the ratio between gold and the S&P 500, we discover that one specific phenomenon has occurred only three times in the last 50 years.
This rare occurrence is quite simple: The gold price falls below 45% of the price of the S&P 500, and then rises back above it to trigger a “Buy” signal on gold.
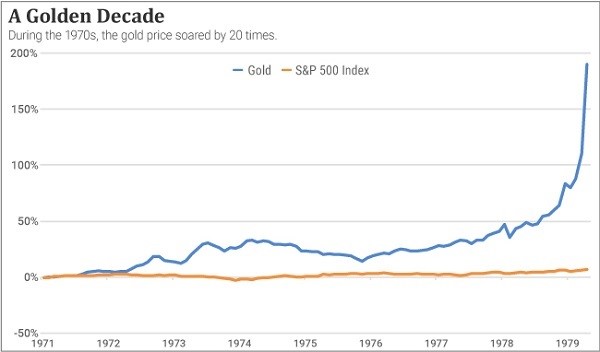
The first two of these instances occurred in 1971 and 2003. After the first one, the gold price rocketed 20 times over.

The second time, the gold price soared five times over.

In each of these instances, the gold price had fallen to such an extreme low, relative to the S&P 500, that it gradually traded back up to a more “normal” level.
It reverted to the mean, and by doing so produced huge gains.
The third time gold traded below 45%, relative to the S&P 500, and then traded up through that level, occurred in October 2018. The gold price is up 40% from that point. If it continues on the path of its predecessors, it will soar to at least $6,000 an ounce.

Remember, this is just a flight of fantasy … or is it?
Consider one final observation.
How We Could Reach Gold $60,000
Most investors assume the Federal Reserve conducts a highly sophisticated monetary policy based on various macroeconomic inputs.
But after cutting through all the Fed-speak and econo-babble, we discover that the Fed is simply printing money, just like hundreds of monetary authorities have done hundreds of times over the last 2,000 years.
That’s not an opinion. It’s a fact.
The U.S. government has not added a single ounce of gold to its reserves since 1971.
Yet, the Federal Reserve has “printed” 17 trillion new dollars since 1971. That’s $17 trillion backed by absolutely nothing more than faith.
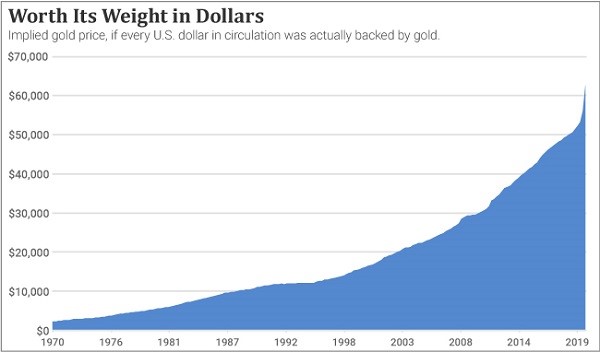
Back in 1971, the United States possessed 1 ounce of gold for every 2,400 dollar bills in existence. Today, the U.S. possesses 1 ounce of gold for every 62,000 dollar bills in existence!

In other words, the only way to reconnect every dollar in existence with a tangible value would be to revalue gold at $62,000 an ounce.
Is that a crazy possibility?
Yes.
Is it impossible?
No.
But remember, this is just a flight of fantasy.
I’m not expecting a $62,000 gold price … just a much higher one than $1,700.
Find out how we’re going after those big gains in Fry’s Investment Report here.
Regards,
Eric Fry
P.S. A year from now, don’t be surprised if you see a headline like this one: “Where Did All the Gold Go?!” The answer will be a simple one… Rich people bought and hoarded it all. Sound crazy? It’s already starting to happen…
Billionaires like “Bond King” Jeffrey Gundlach… Ray Dalio… Stanley Druckenmiller… and Paul Tudor Jones are bullish on the yellow metal. Seventy-eight-year-old billionaire investor Sam Zell just bought gold for the first time in his life. I think you’ll be surprised when you see what this means for the future of the economy. It could have a huge impact on your financial future. Click here to see the full story.
Eric Fry is an award-winning stock picker with numerous “10-bagger” calls — in good markets AND bad. How? By finding potent global megatrends … before they take off. And when it comes to bear markets, you’ll want to have his “blueprint” in hand before stocks go south. Eric does not own the aforementioned securities.