LINK Has Grown 4x In The Last Year, And May Keep Growing
by The Freedonia CooperativeSummary
- Chainlink was likely the best "altcoin" investment of the last 12 months - up nearly 4x from its $1 price last May.
- Partnerships continue to increase, including a high profile one with Tezos, a large altoin project that brought in several millions in its ICO.
- Technical analysis shows a bullish future for LINK despite an already impressive run-up in price. Now may be a time to get in.
ChainLink (LINK-USD) remains one of the blockchain projects that continues to attract demand for its token in the market, despite the bearish run being endured by several other coins. It's not the 12th most valuable coin by market cap (according to Coinmarketcap.com) and has seen USD price growth from $1 to $3.88 in the last 12 months.
This analysis piece for LINK/BTC will examine the price outlook for the pair in a year which has seen some crazy action in the cryptocurrency market.
Fundamental Analysis
ChainLink recently announced a partnership with Kadena to produce a hybrid blockchain. Hybrid blockchains combine permissioned and public blocks to produce a blockchain that synergizes the benefits of the private and public blockchains into one single entity.
Already, the potentials of this hybrid blockchain arrangement for enterprise applications are being felt as Kadena has integrated price feeds from ChainLink into its network for the purposing of pricing its assets and smart contracts.
Kadena is not the only blockchain project that is integrating ChainLink for Oracle projects. Ethereum competitor Tezos is also doing the same. Tezos intends to use Chainlink’s decentralized pricing oracles to obtain real-time data for community projects run on the Tezos network. This also allows projects on Tezos projects to derive active pricing feeds for various assets.
These integrations are expected to continue to help the ChainLink network deepen its footprint in the cryptocurrency space and maintain the uptrend in the price of the LINK token in the long term.
Technical Analysis
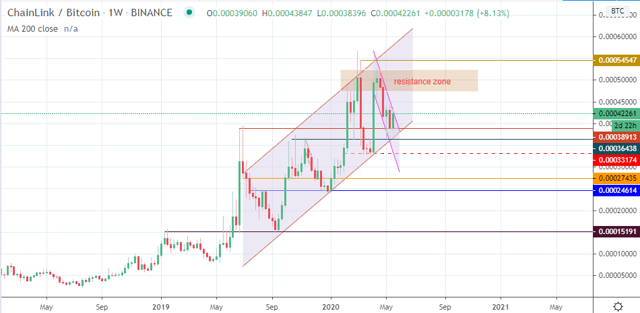
The technical analysis for the ChainLink/Bitcoin (LINKBTC) pair starts from the weekly chart, where some interesting setups are visible. Price action from May 2019 till date is captured in one big ascending channel. Within this channel, the price action for the last six weeks is captured in a smaller, descending channel. The price action within this channel is a retracement wave within the larger channel’s uptrend. The price support and resistance levels are also captured.
Recent price action for the week is captured in a bullish candle which has violated the upper border of the smaller channel, even as Bitcoin prices weaken in the cryptocurrency market.

LINKBTC Weekly Chart: May 22, 2020
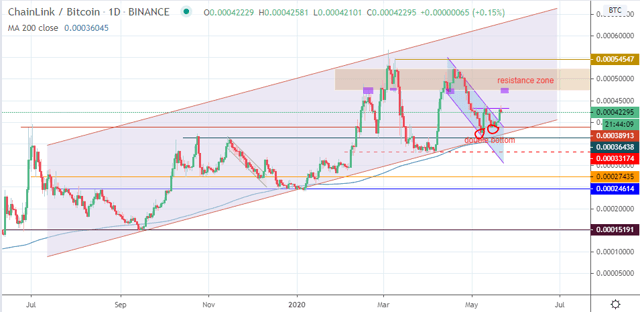
The price violation of the upper border of the descending channel is captured in the snapshot of the daily chart below, where we can see that the price violation is the price leg up that forms the price move from a potential double bottom, up to its neckline that is located at the 0.00043221 price level. The current daily candle is on the verge of violating this neckline, having pushed a little bit above it.
The double bottom will be confirmed if two successive daily candles are able to close above the neckline. This will also confirm in a definitive fashion, the breakout from the descending channel on the weekly chart as well as a resumption of the uptrend, within the context of the larger ascending channel.

LINKBTC Daily Chart: May 22, 2020
If the price action plays out as described above, this would allow LINKBTC to make a move towards the resistance zone which is found between the 0.00047412 price level acting as the floor, and 0.00052259 acting as the ceiling of that resistance zone. Attainment of this zone achieves the price projection via the measure move from the neckline break. However, a break above this resistance zone brings in 0.00054547 (highs of March 5 and 9, 2020) as a potential upside target. The upper border of the ascending channel can only become a feasible target if LINKBTC maintains upside momentum that breaks above 0.00054547. These price moves will all depend on the completion of the double bottom pattern via the break of the neckline.
On the flip side, failure of the upside move can occur at several points. The first point is at the neckline. If price fails to break the neckline, then LINKBTC may pull back to the broken upper border of the smaller descending channel, at the level of the 0.00038913 support line (high of 19/20 March in role reversal as well as 2nd trough of the double bottom pattern occurring on 18 May 2020). A breakdown of this support pushes the price back into the smaller channel, from where it may target the lower border of this channel.
However, the lower border of the ascending channel and the 200-SMA dynamic support line stand in the way of this move. Only a breakdown of these two support pillars allows price to hit the lower border of the descending channel, with the potential to target the 0.00033174 support. Further breakdown of this support confirms price breakdown of the larger ascending channel, which brings in 0.00027435 and 0.00024614 as potential downside targets.
Failure of the upside move may also occur at the resistance zone located above the neckline of the double bottom. This could lead to a pullback which retests the neckline, with potential for either a bounce or a price drop which fulfills the bearish scenario painted above. Ultimately, what will determine these price moves is the behaviour of Bitcoin in its pairing with the US Dollar.
Market Sentiment
- Long term: bullish
- Medium term: neutral
- Short term: bullish
The long-term trend remains bullish as price continues to form higher highs and higher lows, within the large ascending channel. Medium-term outlook is neutral, as further ascent requires price to push above the current neckline resistance and the future resistance zone. Short-term outlook is bullish and depicted by the bullish daily candle of the day, but this needs to be sustained by a breakout confirmation of the neckline.
JOIN THE COIN AGORA
Did you know that Bitcoin is up +83% since 1/1/20? As world markets plummet due to COVID-19, investors are turning to crypto now more than ever.
We provide news, research, technical analysis and more at the Coin Agora on all things crypto!
Sign up now and get instant access to our Pick Portfolio - where three of our picks are up more than 180% in the last 12 months.
Disclosure: I/we have no positions in any stocks mentioned, but may initiate a long position in LINK-USD over the next 72 hours. I wrote this article myself, and it expresses my own opinions. I am not receiving compensation for it (other than from Seeking Alpha). I have no business relationship with any company whose stock is mentioned in this article.