Gold Price Analysis: XAU/USD declines to 2-week lows, challenges $1700/oz
by Flavio Tosti- XAU/USD is erasing the most part of the monthly gains.
- XAU/USD is challenging key levels near the 1690/1700 price zone.
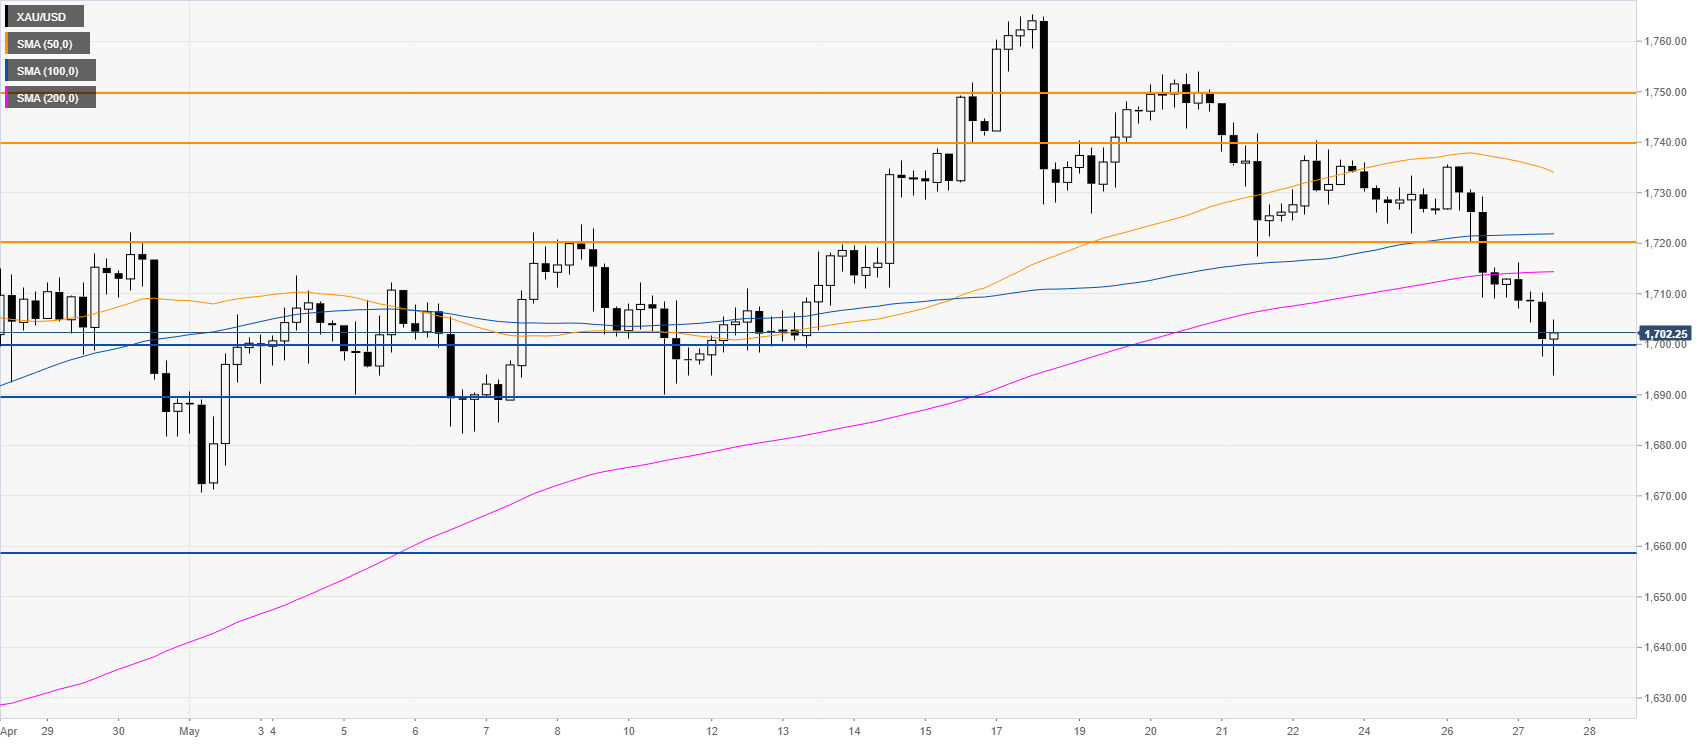
XAU/USD four-hour chart
XAU/USD is losing considerable strength while trading below the main SMAs on the four-hour chart. Gold is slowly reversing its monthly gains while challenging the 1690/1700 price zone. If the market breaks those key levels, gold can see more weakness towards the 1660 level. Resistance can emerge near the 1720 and 1740/50 price zone.

Additional key levels
XAU/USD
| Overview | |
|---|---|
| Today last price | 1701.71 |
| Today Daily Change | -9.33 |
| Today Daily Change % | -0.55 |
| Today daily open | 1711.04 |
| Trends | |
|---|---|
| Daily SMA20 | 1716.43 |
| Daily SMA50 | 1671.32 |
| Daily SMA100 | 1629.66 |
| Daily SMA200 | 1561.83 |
| Levels | |
|---|---|
| Previous Daily High | 1735.69 |
| Previous Daily Low | 1709.09 |
| Previous Weekly High | 1765.38 |
| Previous Weekly Low | 1717.34 |
| Previous Monthly High | 1747.82 |
| Previous Monthly Low | 1568.46 |
| Daily Fibonacci 38.2% | 1719.25 |
| Daily Fibonacci 61.8% | 1725.53 |
| Daily Pivot Point S1 | 1701.52 |
| Daily Pivot Point S2 | 1692.01 |
| Daily Pivot Point S3 | 1674.92 |
| Daily Pivot Point R1 | 1728.12 |
| Daily Pivot Point R2 | 1745.21 |
| Daily Pivot Point R3 | 1754.72 |