GBP/JPY Price Analysis: Pound weakens vs. Japanse yen, nearing the 132.00 figure
by Flavio Tosti- GBP/JPY retraces down after the recent surge to the 133.00 figure.
- The level to beat for bears is the 133.25 support.
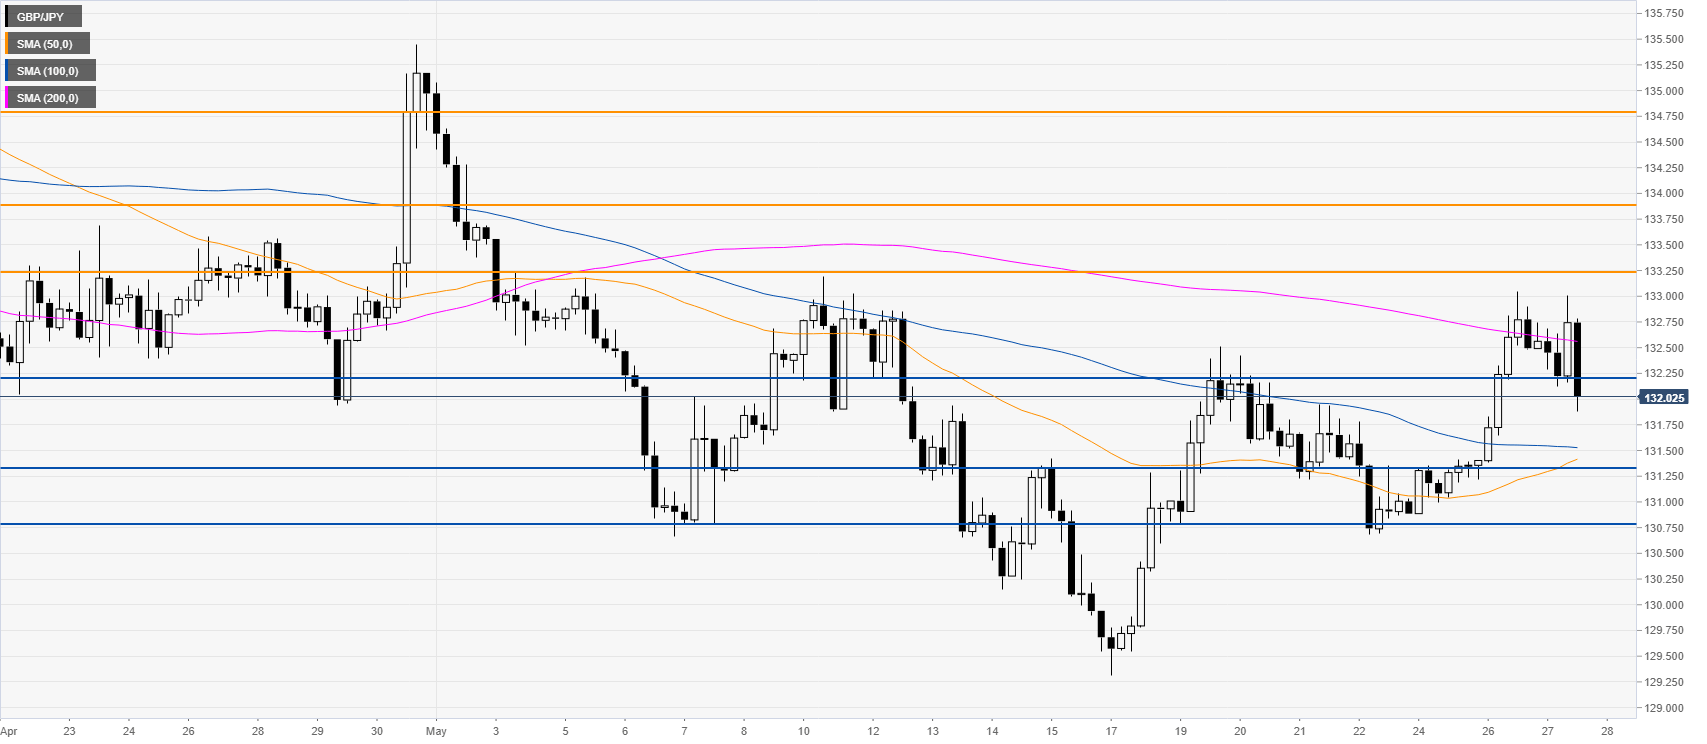
GBP/JPY four-hour chart
After breaking to its highest since the 11th of May 2020, GBP/JPY is retracing down breaking below the 132.25 support level. The spot is trading below the 200 SMA on the four-hour chart while maintaining an overall bearish bias. A daily close below the 132.25 level would be seen as bearish with the potential to revisit the 131.33 and 130.75 levels. On the other hands, if the spot regains strength above the 133.25 level, GBP/JPY could be in a position to accelerate to the upside.

Resistance: 133.25, 133.87, 134.83
Support: 132.25, 131.33, 130.80
Additional key levels
GBP/JPY
| Overview | |
|---|---|
| Today last price | 132.02 |
| Today Daily Change | -0.63 |
| Today Daily Change % | -0.47 |
| Today daily open | 132.65 |
| Trends | |
|---|---|
| Daily SMA20 | 131.92 |
| Daily SMA50 | 132.49 |
| Daily SMA100 | 136.67 |
| Daily SMA200 | 137.24 |
| Levels | |
|---|---|
| Previous Daily High | 133.04 |
| Previous Daily Low | 131.25 |
| Previous Weekly High | 132.51 |
| Previous Weekly Low | 129.32 |
| Previous Monthly High | 135.75 |
| Previous Monthly Low | 131.91 |
| Daily Fibonacci 38.2% | 132.36 |
| Daily Fibonacci 61.8% | 131.94 |
| Daily Pivot Point S1 | 131.59 |
| Daily Pivot Point S2 | 130.53 |
| Daily Pivot Point S3 | 129.8 |
| Daily Pivot Point R1 | 133.38 |
| Daily Pivot Point R2 | 134.11 |
| Daily Pivot Point R3 | 135.17 |