AT&T Vs. Verizon: A Comparison Of Debt
by Brad KenagySummary
- I conduct a comparison of AT&T and Verizon debt.
- I examined credit ratings, maturity, coupon, currency, and interest payments.
- After looking at all the data, it became clear that one company is superior to the other in terms of its debt profile.

Image Source
In this article, I am going to be comparing AT&T (T) to Verizon (VZ). After reading that first sentence, I know what you are thinking, "another article of seeing who has the best dividend or which one is the better choice for income". Those topics have been widely covered for a long time, and the debate is ongoing. Instead, I am going to take a different approach and focus on a comparison of the debt for AT&T and Verizon. However, in the end, it becomes clear that one company is superior to the other in terms of its debt profile.
Debt Summary
At the end of Q1 2020, AT&T had $147.202 billion in long-term debt and $17.067 billion in debt that is maturing within one year. Verizon has $106.561 billion in long-term debt and $11.175 billion in debt that is maturing within one year. Both of these numbers are staggering to think about. However, both companies generate substantial cash flows to service and pay off debt. Because each company has so much debt, both have great resources on their respective investor relations pages that cover the debt.
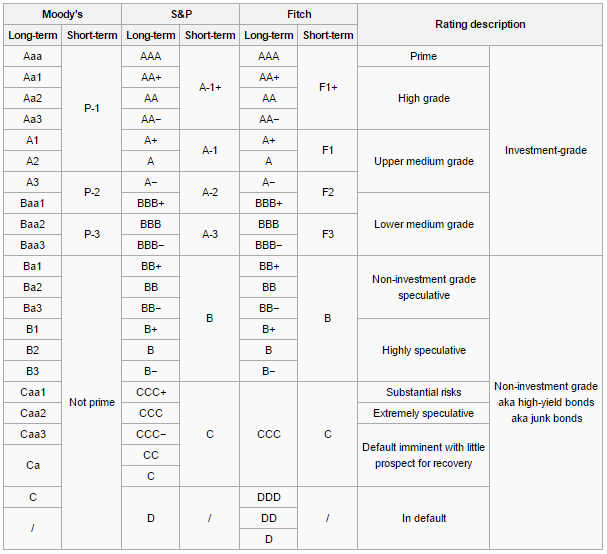
The first chart below shows the current AT&T credit ratings and outlook for the major credit ratings agencies. The second chart shows the current Verizon credit ratings and the outlook from each ratings agency. The third and final chart shows a breakdown of where each company is on the credit ratings scale. The three charts below show that AT&T debt is a notch below Verizon and that Verizon has a positive outlook from 2/3 ratings agencies vs. 3 stable outlooks for AT&T.

*AT&T
AT&T debt summary page
*Verizon

Verizon debt summary page
*Color boxes added by author
Verizon = Red
AT&T = Blue

Image Source: Benzinga
Maturity Year
For AT&T and Verizon, I broke down by debt by maturity year and expressed the data as a percentage of total debt. Because the dollar value of debt is different for each company to get them onto the same scale for an accurate apples to apples comparison, I calculated each year as a percentage of total debt. You will notice that the first chart has three categories for each year, the green column for Verizon includes short-term and long-term private placements listed on the Verizon debt summary. I also included the red column that excludes those private placements, since they have no details on them other than the total amount. The second chart is simply a comparison of the Verizon data, excluding the private placements compared to AT&T (blue column).

Table data from AT&T and Verizon debt summaries

Table data from AT&T and Verizon debt summaries
The above data shows Verizon has less debt coming due over the next three years than AT&T. The following table breaks down the data by decade, and I included data for 2020-2022. As of percentage of total debt, Verizon has less debt coming due in the 2020s than AT&T regardless if the short-term private placement is included.
| VZ | VZ Ex PP | T | |
| 2020-2029 | 44.89% | 46.23% | 51.79% |
| 2030-2039 | 21.98% | 27.30% | 16.01% |
| 2040-2049 | 13.75% | 17.08% | 26.85% |
| 2050 + | 19.38% | 9.39% | 5.34% |
| 2020-2022 | 14.85% | 8.92% | 18.08% |
Table data from AT&T and Verizon debt summaries
Coupon
The next item I will be looking at is fixed vs. floating rate debt for AT&T and Verizon. This is another data point where I had data with the private placements and without, since there is no data for the interest rate on the private placements. If you exclude the private placements, which the middle column in the table below does, Verizon has slightly more fixed debt than AT&T. I also compiled all the data for each company to find the weighted interest rate for all the fixed rate debt that each company has. The data shows that the average weighted interest rate for fixed debt for Verizon is 3.95% and 4.15% for AT&T. While not a huge difference between the two, if AT&T had the weighted average interest rate that Verizon does, they would be able to save around $300 million on interest payments.
| VZ | VZ Ex PP | T | |
| Fixed | 77.18% | 95.87% | 90.48% |
| Floating | 3.32% | 4.13% | 8.19% |
| Private/Various | 19.50% | 0.00% | 1.33% |
Table data from AT&T and Verizon debt summaries
Currency
Both AT&T and Verizon have issued debt in a variety of currencies, with the majority being in dollars. Verizon has slightly more debt that has been issued in US Dollars in comparison to AT&T. I like to see companies that issue debt in US Dollars because then you do not have to deal with the impact of currency, etc. There are exceptions to that though, if the company is high quality, they could borrow at ultra-low rates because interest rates ex-US are low. For example, I remember this story from 5 years ago where Apple (AAPL) issued Swiss Franc denominated bonds in terms of 10 years and 15 years at rates of 0.281% and 0.74%, respectively. If a company is able to get those ultra-low rates, it does make sense to allocate some debt issuance to foreign currencies if applicable.
| Currency | VZ | T |
| US Dollar | 83.09% | 75.97% |
| Euro | 12.64% | 16.82% |
| British Pound | 3.42% | 4.42% |
| Swiss Franc | 0.86% | 0.38% |
| Canadian Dollar | 0.00% | 1.90% |
| Australian Dollar | 0.00% | 0.50% |
Table data from AT&T and Verizon debt summaries
Interest Metrics
When evaluating the debt of a company and thus their interest payments, there are a couple simple metrics that I like to use, especially when comparing two companies. The first metric I like to use is interest expense as a percentage of operating income. The following table shows a comparison of this for Verizon and AT&T for Q1 2020. As you can see, nearly 27% of operating income went to interest expense compared to just under 16% for Verizon.
*Data in millions
| VZ | T | |
| Operating Income | $6,579 | $7,486 |
| Interest Expense | $1,034 | $2,018 |
| Interest as % of Operating Income | 15.72% | 26.96% |
Table data from AT&T and Verizon Q1 2020 reports
Expanding on the above table, I also like to see what the data looks like after interest expense is taken out of operating income and the relation to dividend payments. The purpose of doing this is to get a good feel for the dividend coverage that each company has in an apples to apples way. The data shows Verizon is far superior in terms of dividend coverage than AT&T.
*Data in millions
| VZ | T | |
| Operating Income | $6,579 | $7,486 |
| Interest Expense | $1,034 | $2,018 |
| Op. Inc - Interest | $5,545 | $5,468 |
| Dividends | $2,547 | $3,737 |
| (Op. Inc-Interest) / Dividends | 2.18 | 1.46 |
Table data from AT&T and Verizon Q1 2020 reports
Closing Thoughts
In closing, after looking through all the debt and associated metrics, ratings, etc., I believe Verizon is in a superior position to AT&T with its debt. Verizon has less debt coming due over the next three years, a higher percentage of fixed rate debt, a lower weighted interest rate on fixed debt, a better credit rating, and more debt denominated in US Dollars. In my opinion, when you put all the debt data together, it means that Verizon will be able to survive and thrive better than AT&T with the continued roll-out of 5G over the next three years as well as any uncertainty around COVID-19.
In Q1 2020, results showed revenues for AT&T were down 4.6% year/year compared to down 1.6% year/year for Verizon. It is not just a one-quarter phenomenon with AT&T posting declining revenues. If you look back to Q4 2019, AT&T was down 2.4% compared to Verizon, which grew revenues 1.4%. While the nearly 7% yield for AT&T looks tempting, to me at least, the 4.55% yield looks more appealing because of the superior debt profile and better business stability Verizon has.
Disclosure: I/we have no positions in any stocks mentioned, and no plans to initiate any positions within the next 72 hours. I wrote this article myself, and it expresses my own opinions. I am not receiving compensation for it (other than from Seeking Alpha). I have no business relationship with any company whose stock is mentioned in this article.