Global Yields For Stocks And Bonds
by PloutosSummary
- The U.S. stock market has continued its decade-plus of dominance versus global peers during the 2020 sell-off despite a less-than-stellar domestic response to the global health crisis.
- Differences in growth rates, real interest rates, and index and economic composition will necessarily lead to some performance dispersion, but placing domestic markets in a global context helps frame valuations.
- U.S. stocks, particularly the tech-focused Nasdaq, are trading at above average valuations, especially when adjusted for (relatively) higher interest rates in the U.S.
Like many U.S. investors, I have a U.S.-centric investment portfolio. Since the beginning of the last financial crisis, having a U.S.-focused portfolios has been a good trade. Since the end of 2007, the S&P 500 (SPY) has returned 8.2% annualized while the MSCI All Country World Index ex-US (ACWX) has returned investors a middling 0.4% per year. In the 2020 virus-related market correction, U.S. stocks have declined far less than global stocks despite the U.S. having the ignominy of leading the world in both reported cases and deaths.
In a pair of recent articles, I have begun exploring U.S. stocks versus their global counterparts. In U.S. Versus the World: Virus and Stock Markets, I took a long-term look at the relative performance of U.S. and global stocks and highlighted the divergence in 2020. In Rolling Returns: U.S. Versus the World, I looked at the performance differential for U.S. and global stocks over 1, 3, 5, and 10-year periods dating back to the late 1960s. Relative gains for U.S. stocks over intermediate to longer periods are at their largest positive differential versus global stocks since the Tech Bubble.
In this article, I want to look at where U.S. equity multiples are relative to those in other large global markets. Given the uncertainty around the denominator in price/earnings multiples, we will look at both trailing earnings and estimates of forward earnings with the caveat that there needs to be an appropriate error band drawn around those forward earnings figures given their potential wide ranges in an environment where many companies have abandoned forward guidance.
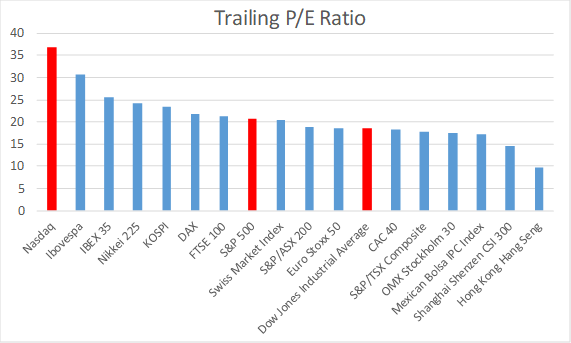
The first chart in this piece shows trailing P/E ratios by country. The trailing P/E ratios take the current index level and divide by trailing 12-month earnings excluding extraordinary items. There are many different ways to view earnings multiples, and mine could differ from yours. I have chosen two approaches and applied them consistently across global indices.
The tech-fueled Nasdaq (QQQ) sits as an outlier at roughly 37x trailing earnings. Of course, Amazon (AMZN), at 115x trailing earnings and 9.9% of the index, contributes nearly 30% of that multiple itself. The Nasdaq is the only one of these indices with positive total returns year-to-date (+8%). Trailing earnings multiples for the S&P 500, while still historically elevated at over 20x, look more modest in this context, trailing markets from Brazil, Spain, Japan, South Korea, Germany, and the United Kingdom. The Dow Jones Industrial Average (DIA) has lagged its domestic peers appreciably in 2020 from a performance standpoint, and carries a below median current earnings multiple.

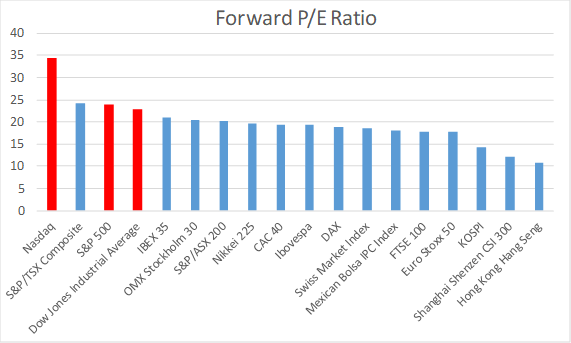
Using Bloomberg estimates for forward earnings for the next four quarters, the next graph has estimates of forward earnings multiples for the same global indices. As discussed at the outset, these are not decimal point estimates and require a wider latitude around their likely outcome. The takeaway should be that stocks today in the United States are trading at a higher multiple of forward earnings from a standardized source across countries. The only other market that split up the presence of the U.S. indices at the far left of the graph was the Canadian benchmark.

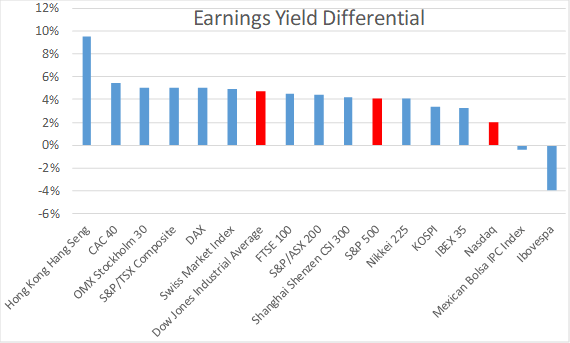
In the third graph, I flipped the price/earnings ratio on its head and created an earnings yield. From the earnings yield based on trailing earnings, I subtracted prevailing 10-year government bond yields in local currency for each country. Part of the argument for above average multiples in the United States at the precipice of an earnings recession would be that historically low interest rates should provide a ballast for equity multiples. The other argument would be that investors, buoyed by extraordinary monetary and fiscal stimulus, are now looking through transient stress for a future rebound in economic and earnings growth.

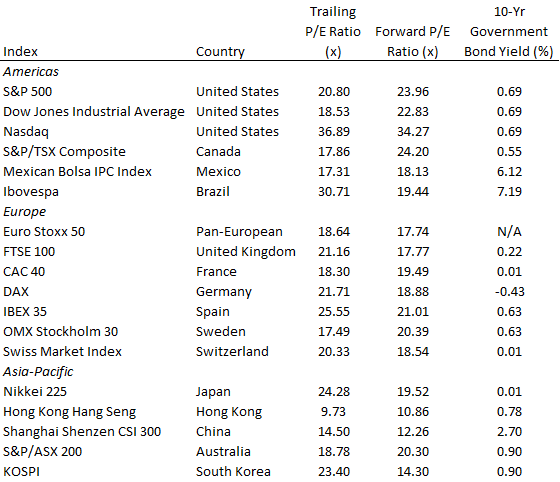
Bullish investors who point to rising earnings yield differentials in the United States could be re-directed to comps in Europe or parts of Asia where both equity multiples and interest rates are lower than in the United States. In the table below, I depict the trailing and forward P/E ratios and sovereign bond yields used in this article with data as of the most recent U.S. close on May 26th.

On a global basis, stocks in the United States look relatively expensive. The tech-fueled Nasdaq, and the tech-influenced S&P 500, look more expensive. Tech (XLK) was a great trade in 2019, and in this economic shutdown where more of the economy has moved online, it has once again driven parts of the U.S. market to outperformance. I am skeptical of the view that the tech giants in the United States should be viewed as a haven in this environment. Business models necessarily change quickly in tech, China will loom as a more worthy challenger in the future of global tech in coming years, and equity multiples are already high. Parts of my portfolio have structurally underweight tech to the detriment of portfolio performance. That is not a bet I want to reverse here.
Hong Kong sticks out as a cheap outlier herein, given the dual shocks of the COVID-19 impact and the ongoing tussle with the mainland. Brazil feels relatively expensive. A pan-Emerging Markets bet gives investors a mixed bag of relative valuations in the current environment. Developed markets outside of the United States offer cheaper multiples and lower interest rates. The question for investors has to be whether the lower multiples are simply a reflection of slower earnings growth from "old economy" sectors? Are lower interest rates in other developed economies simply a function of lower forward economic growth? The answer to both questions is to some degree yes. However, after more than a decade of underperformance, global stocks feel poised to catch-up to some degree. I hope this article gives a helpful high level view of the relative earnings multiples of U.S. stocks versus global peers as Seeking Alpha readers also consider their global diversification.
Disclaimer: My articles may contain statements and projections that are forward-looking in nature, and therefore inherently subject to numerous risks, uncertainties and assumptions. While my articles focus on generating long-term risk-adjusted returns, investment decisions necessarily involve the risk of loss of principal. Individual investor circumstances vary significantly, and information gleaned from my articles should be applied to your own unique investment situation, objectives, risk tolerance and investment horizon.
Disclosure: I am/we are long SPY. I wrote this article myself, and it expresses my own opinions. I am not receiving compensation for it (other than from Seeking Alpha). I have no business relationship with any company whose stock is mentioned in this article.