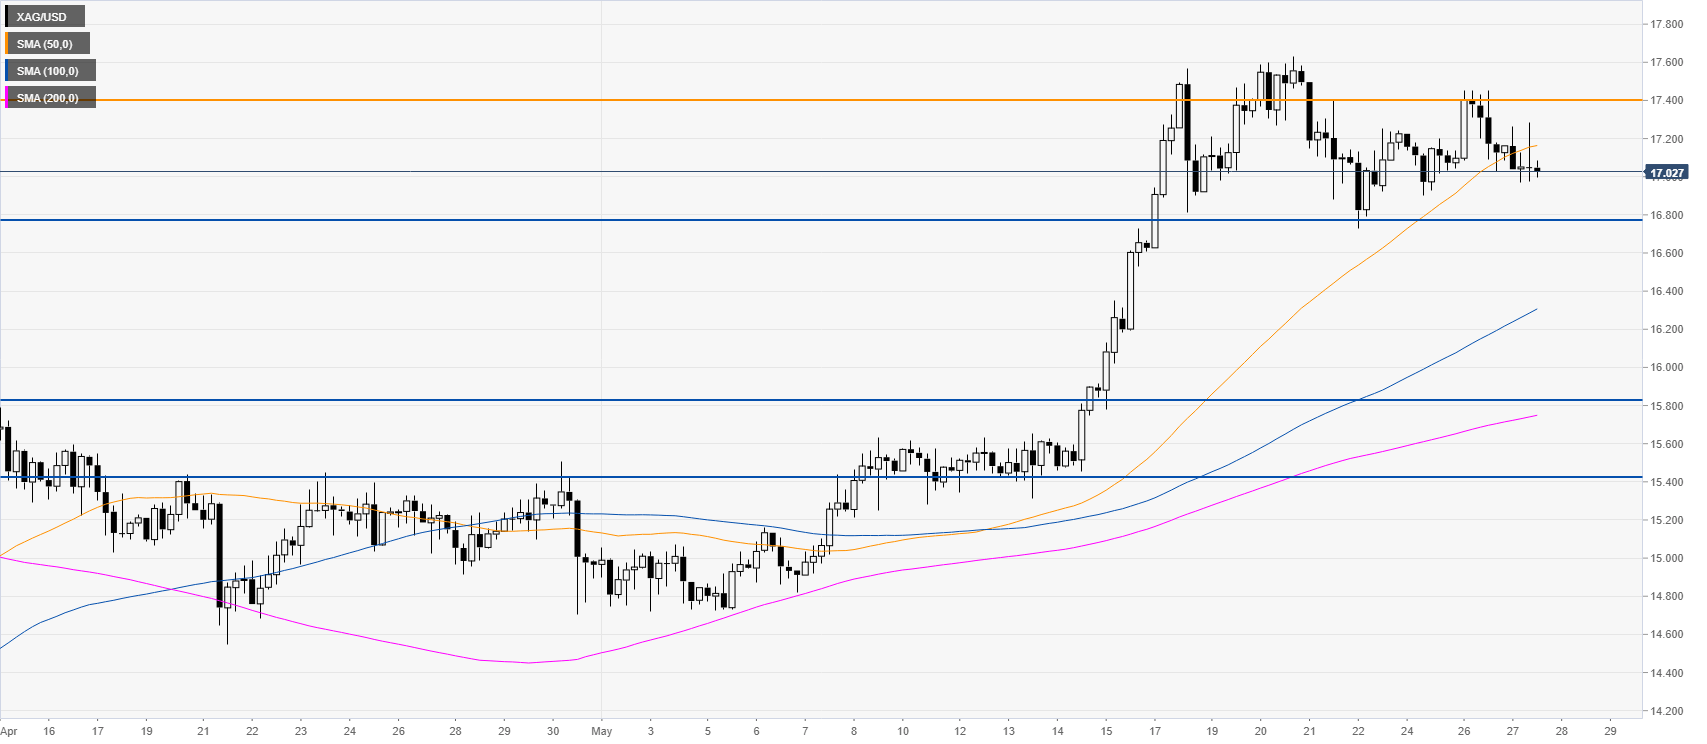
Silver New York Price Forecast: XAG/USD trades sideways near $17.00/oz
by Flavio Tosti- XAG/USD is consolidating off the monthly tops.
- Support can emerge near the 16.80 level.
Silver four-hour chart
Silver is trading off 10-week tops just below the $17.45 per troy ounce level. Bulls are losing steam as XAG/USD trades below the 50 SMA on the four-hour chart. In this context, a break below the 16.80 support cannot be ruled out. On the other hand, a daily break above the 17.45 level can lead to further upside with 18.20 and 18.80 on the radar.

Resistance: 17.45, 18.20, 18.80
Support: 16.80, 15.84, 15.42
Additional key levels
XAG/USD
| Overview | |
|---|---|
| Today last price | 17.03 |
| Today Daily Change | -0.11 |
| Today Daily Change % | -0.64 |
| Today daily open | 17.14 |
| Trends | |
|---|---|
| Daily SMA20 | 16 |
| Daily SMA50 | 15.1 |
| Daily SMA100 | 16.33 |
| Daily SMA200 | 16.95 |
| Levels | |
|---|---|
| Previous Daily High | 17.45 |
| Previous Daily Low | 17.03 |
| Previous Weekly High | 17.63 |
| Previous Weekly Low | 16.63 |
| Previous Monthly High | 15.85 |
| Previous Monthly Low | 13.82 |
| Daily Fibonacci 38.2% | 17.29 |
| Daily Fibonacci 61.8% | 17.19 |
| Daily Pivot Point S1 | 16.96 |
| Daily Pivot Point S2 | 16.78 |
| Daily Pivot Point S3 | 16.53 |
| Daily Pivot Point R1 | 17.38 |
| Daily Pivot Point R2 | 17.63 |
| Daily Pivot Point R3 | 17.81 |