USD/INR New York Price Forecast: Greenback stabilizing near the 75.75 level vs. Indian rupee
by Flavio Tosti- USD/INR is bouncing off the 75.50 support as the New York forex session is starting.
- Resistance can emerge near the 76.00 figure.
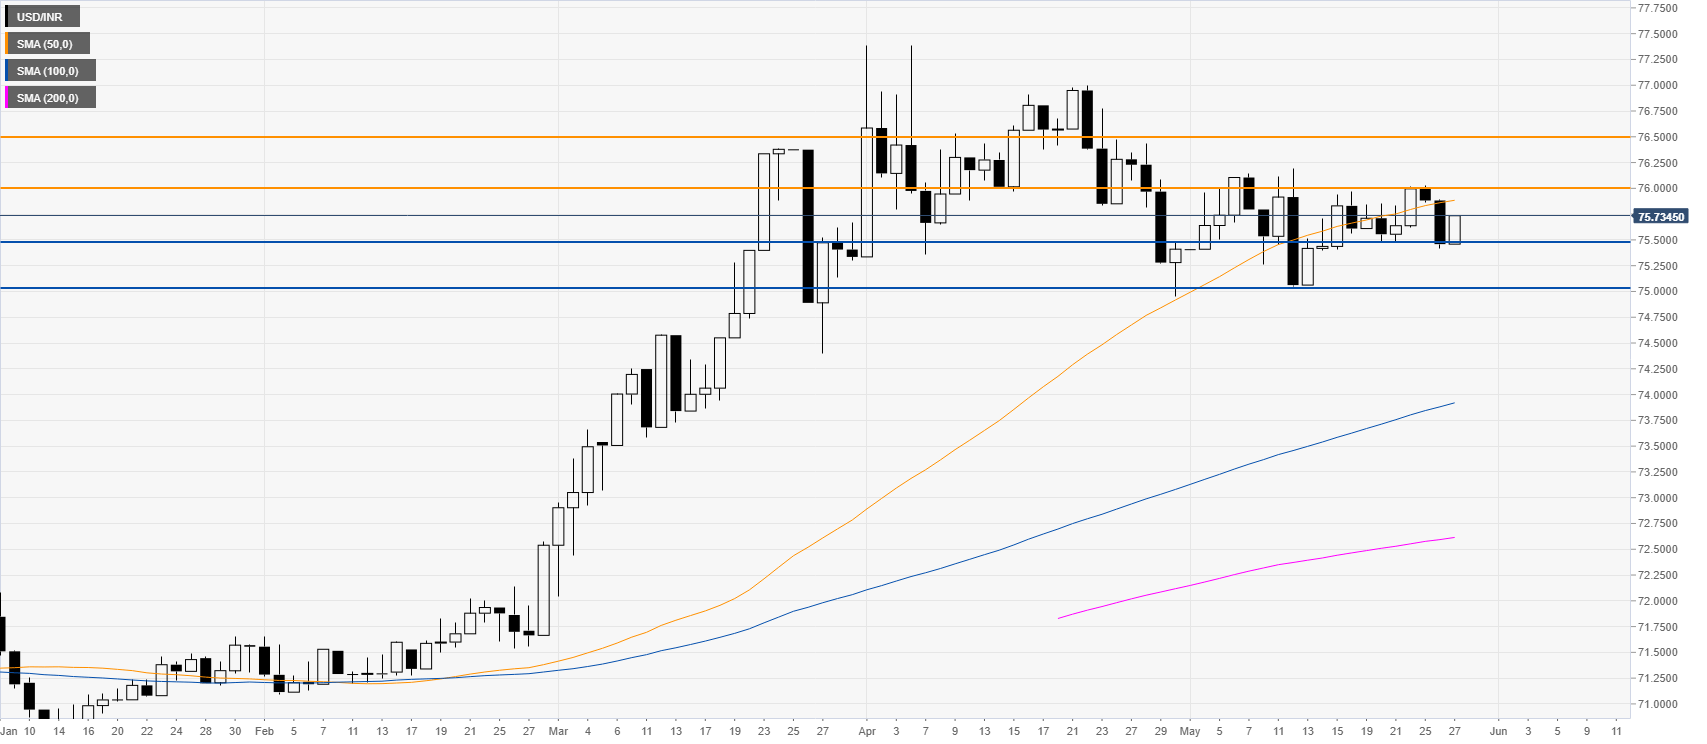
USD/INR daily chart
USD/INR is stabilizing above the 75.50 support level while still below the 50 SMA on the daily chart. The market has been struggling to find a direction in May while confined in the 75.00/76.00 range. A daily close below the 75.50 level can yields more down with 75.00 as a potential target. On the other hand, resistance can emerge near the 76.00 figure.

Additional key levels
USD/INR
| Overview | |
|---|---|
| Today last price | 75.7395 |
| Today Daily Change | 0.2806 |
| Today Daily Change % | 0.37 |
| Today daily open | 75.4589 |
| Trends | |
|---|---|
| Daily SMA20 | 75.645 |
| Daily SMA50 | 75.846 |
| Daily SMA100 | 73.9039 |
| Daily SMA200 | 72.6083 |
| Levels | |
|---|---|
| Previous Daily High | 75.8896 |
| Previous Daily Low | 75.4204 |
| Previous Weekly High | 76.0223 |
| Previous Weekly Low | 75.4707 |
| Previous Monthly High | 76.975 |
| Previous Monthly Low | 75.14 |
| Daily Fibonacci 38.2% | 75.5996 |
| Daily Fibonacci 61.8% | 75.7104 |
| Daily Pivot Point S1 | 75.2897 |
| Daily Pivot Point S2 | 75.1204 |
| Daily Pivot Point S3 | 74.8205 |
| Daily Pivot Point R1 | 75.7589 |
| Daily Pivot Point R2 | 76.0588 |
| Daily Pivot Point R3 | 76.2281 |