Gold Price News and Forecast: XAU/USD tumbled to 1,705.00
by FXStreet TeamXAU/USD – Gold price trend before Nonfarm Payrolls
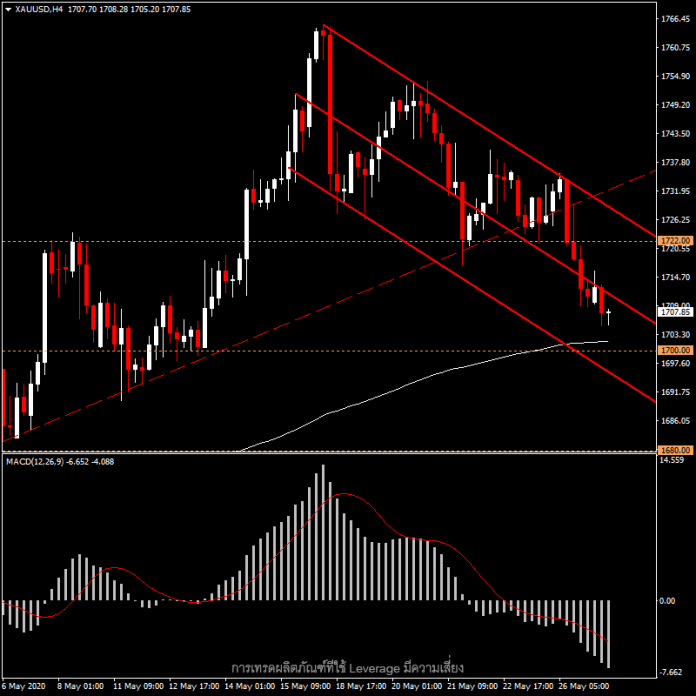
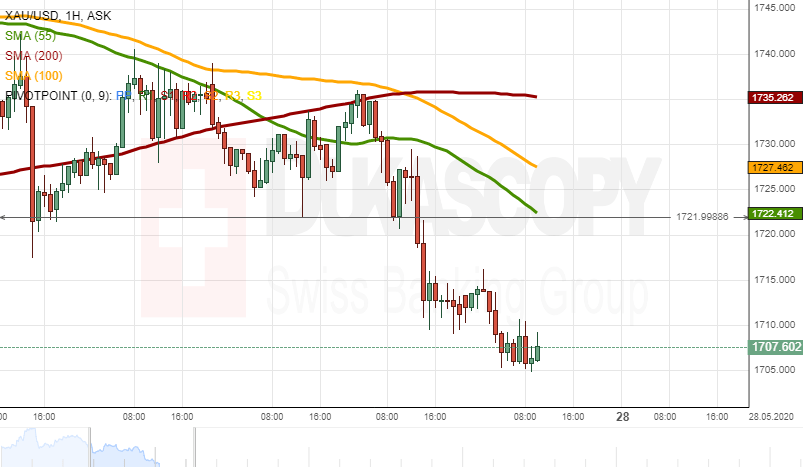
Lately, gold price has responded with lower economic numbers, because the recent economic numbers reflect the impact of the outbreak of Covid-19, and gold prices have already responded to the role of safe haven. However, last night, gold prices returned to meet with economic numbers again. The expected number of US unemployed last week was 3 million, resulting in gold prices moving up slightly before the announcement. When the number announced was 3.169 million, higher than expected, gold prices moved up to test the resistance zone at 1722.
The number of unemployment claims came out higher than expected, resulting in yesterday’s USDIndex closing below 100.00. Read More...

XAU/USD analysis: Tumbled to 1,705.00
Yesterday, the XAU/USD exchange rate tumbled to the 1,710.00 level. During Wednesday morning, the rate declined below the given level.
From the one hand, it is likely that some downside potential could prevail in the market. In this case the rate could target the 1,690.00/1,700.00 area. Read More...

Gold trades with modest losses, holds above $1700 amid escalating US-China tensions
Gold dropped to fresh two-week lows during the early European session and was last seen trading with modest losses, just above the $1700 mark.
The commodity struggled to capitalize on its early uptick to the $1716 area, instead met with some fresh supply and drifted into the negative territory for the third consecutive session. The downtick, also marking the metal's fourth day of a negative move in the previous five, was sponsored by the upbeat mood around the global equity markets and a goodish pickup in the US dollar demand. Read More...
XAU/USD
| Overview | |
|---|---|
| Today last price | 1704.55 |
| Today Daily Change | -6.49 |
| Today Daily Change % | -0.38 |
| Today daily open | 1711.04 |
| Trends | |
|---|---|
| Daily SMA20 | 1716.43 |
| Daily SMA50 | 1671.32 |
| Daily SMA100 | 1629.66 |
| Daily SMA200 | 1561.83 |
| Levels | |
|---|---|
| Previous Daily High | 1735.69 |
| Previous Daily Low | 1709.09 |
| Previous Weekly High | 1765.38 |
| Previous Weekly Low | 1717.34 |
| Previous Monthly High | 1747.82 |
| Previous Monthly Low | 1568.46 |
| Daily Fibonacci 38.2% | 1719.25 |
| Daily Fibonacci 61.8% | 1725.53 |
| Daily Pivot Point S1 | 1701.52 |
| Daily Pivot Point S2 | 1692.01 |
| Daily Pivot Point S3 | 1674.92 |
| Daily Pivot Point R1 | 1728.12 |
| Daily Pivot Point R2 | 1745.21 |
| Daily Pivot Point R3 | 1754.72 |