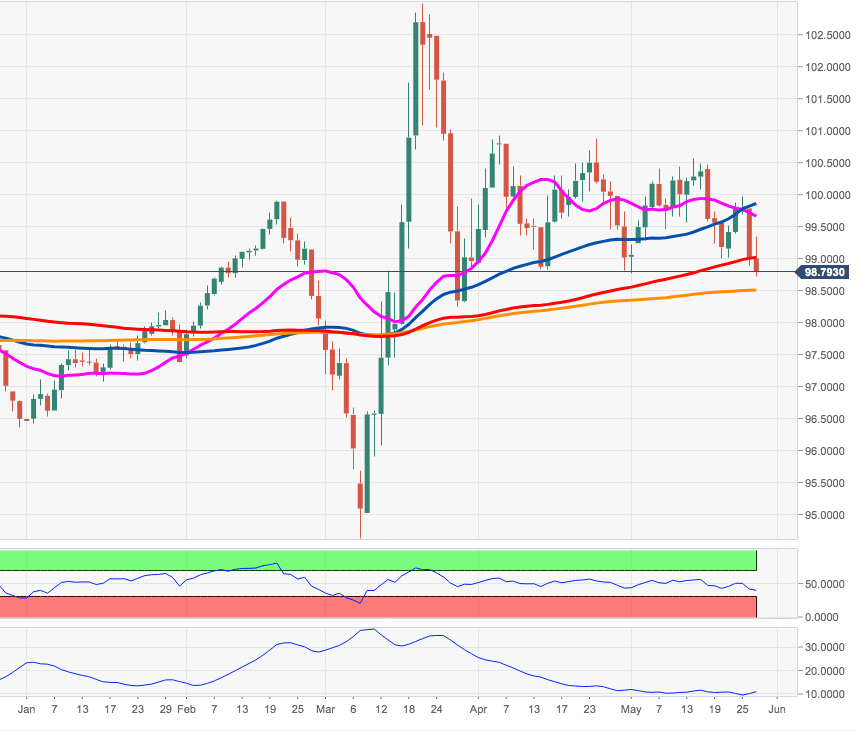
US Dollar Index Price Analysis: Rising odds for a move to 98.50
by Pablo Piovano- DXY accelerates the downside on Wednesday and drops below 99.00.
- The door is now open for a potential move to the 200-day SMA.
DXY is losing the grip further on Wednesday, extending the decline for the second consecutive session after being rejected from the 100.00 mark at the beginning of the week.
Sellers now look to have regained the upper hand and therefore the door is open to further weakness in the dollar in the near-term.
That said, there is increasing bets for a deeper pullback to the 200-day SMA in the mid-98.00s in the short-term horizon.
DXY daily chart

Dollar Index Spot
| Overview | |
|---|---|
| Today last price | 98.79 |
| Today Daily Change | 62 |
| Today Daily Change % | -0.21 |
| Today daily open | 99 |
| Trends | |
|---|---|
| Daily SMA20 | 99.71 |
| Daily SMA50 | 100 |
| Daily SMA100 | 99 |
| Daily SMA200 | 98.51 |
| Levels | |
|---|---|
| Previous Daily High | 99.78 |
| Previous Daily Low | 98.9 |
| Previous Weekly High | 100.47 |
| Previous Weekly Low | 99 |
| Previous Monthly High | 100.93 |
| Previous Monthly Low | 98.81 |
| Daily Fibonacci 38.2% | 99.24 |
| Daily Fibonacci 61.8% | 99.45 |
| Daily Pivot Point S1 | 98.67 |
| Daily Pivot Point S2 | 98.34 |
| Daily Pivot Point S3 | 97.78 |
| Daily Pivot Point R1 | 99.56 |
| Daily Pivot Point R2 | 100.12 |
| Daily Pivot Point R3 | 100.45 |