How to Trade Alibaba Stock After Underwhelming Earnings Fizzled Its Takeoff
If BABA beckons, consider credit spreads to profit from the chop
Compared to the fireworks popping off elsewhere in the technology sector, the lackluster action in Alibaba (NYSE:BABA) has kept buyers at bay. For example, just when it looked like Alibaba stock was breaking out to join its booming tech brethren, underwhelming earnings arrived to thwart the take-off.
Today we’re taking a fresh look at the chart and suggesting how bulls and bears can trade moving forward. Let’s begin with a brief word on earnings.
About Friday’s Slide
For a full breakdown of the numbers, you can check out InvestorPlace’s William White’s take here. Some readers may rightly ask why I would characterize them as “underwhelming” when the company beat the Street’s estimates. Here’s my justification. It’s not the news that matters, it’s the reaction to the news. I don’t pretend to be smarter than the collective wisdom of Wall Street. Nor do I want to fight the crowd. The lens by which I view if a quarterly report was bullish or bearish is the stock price’s response. If the market doesn’t like, then neither do I. And, judging by Friday’s 5.9% drubbing, investors jammed down the sell button on what seemed to be good numbers.
Maybe forward estimates weren’t as rosy as desired, or maybe traders were simply in a mood to sell the good news. It could also have been a one-day whack and not the beginning of larger liquidation. This is where analyzing the price chart and discovering just how much damage was done becomes a critical exercise in setting expectations moving forward.
Alibaba Stock Charts
Unlike the overwhelmingly bullish message being broadcast by sector- and market-leading behemoths like Apple (NASDAQ:AAPL) and Facebook (NASDAQ:FB), the action in BABA is decidedly more mixed, especially after earnings. Alibaba was looking up before last week’s down gap threw a wrench into the recovery. Let’s begin with the weekly view.

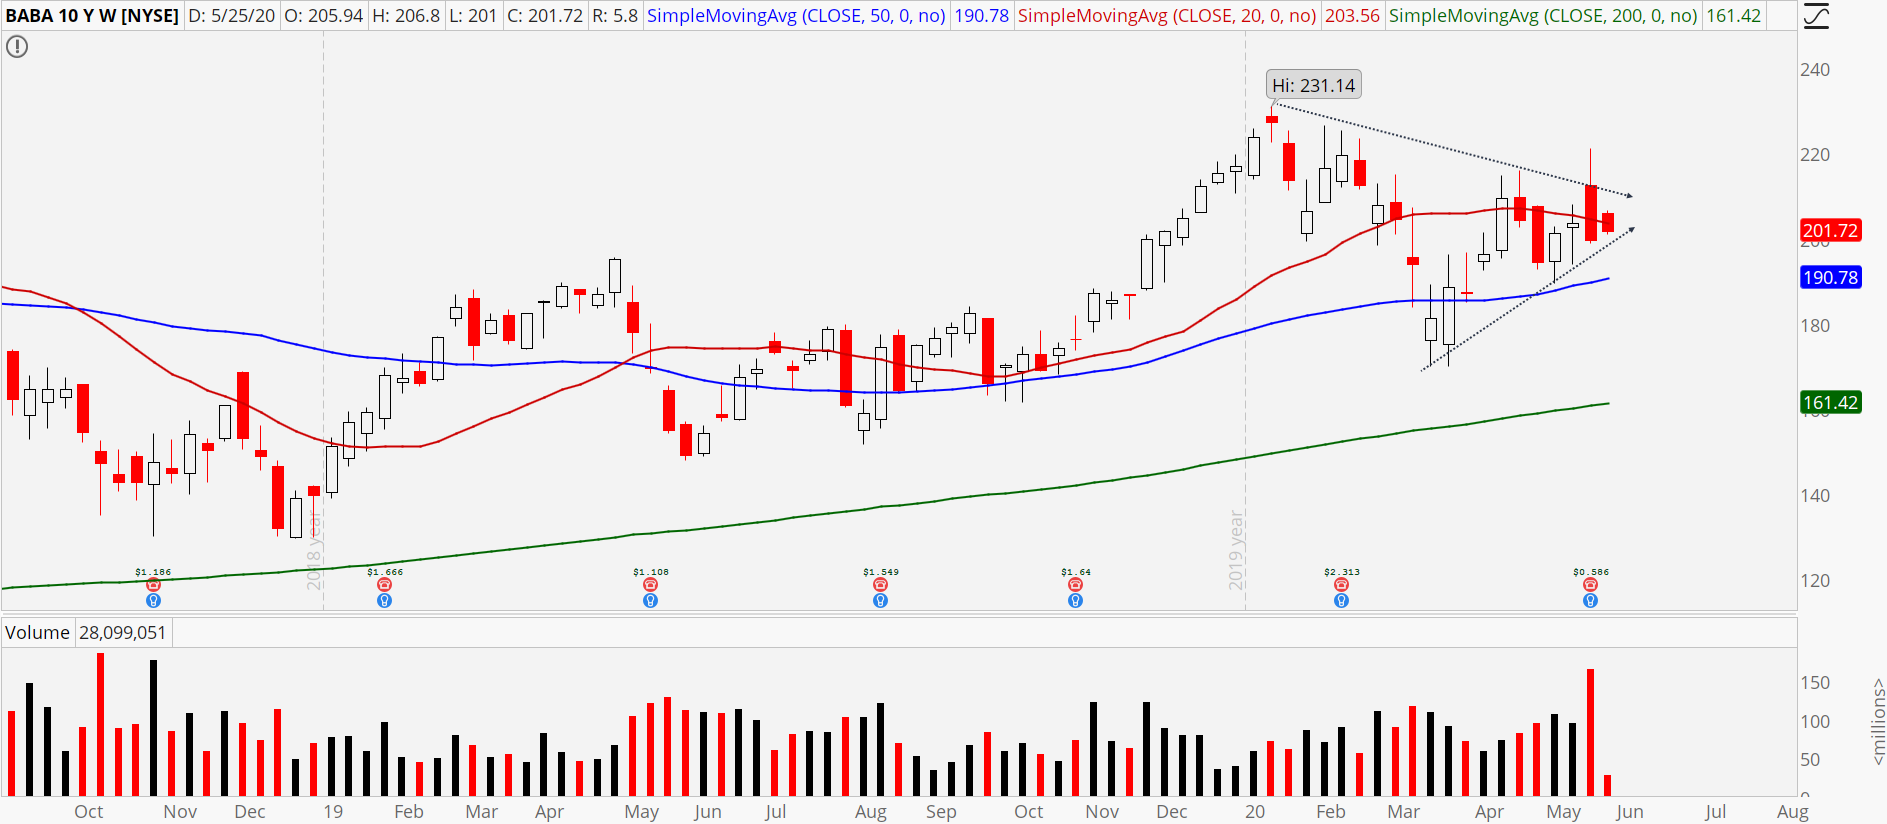
The rising 200-week and 50-week moving averages confirm buyers still control the long-term uptrend. But things turn dicey in the shorter-term. The 20-week moving average is rolling over and should give buyers pause. From a pattern perspective, a sloppy symmetrical triangle has formed, which shows long-term bulls and short-term bears at a stalemate. Placing directional trades against such a backdrop is a high risk. It’s usually best to wait for the formation to resolve itself in one direction or the other before betting.
A break over $216 resistance or under $190 support would do the trick on the weekly time frame. Sometimes the daily chart provides more clarity or at least closer levels to build trades around, but unfortunately, we have no such luck with Alibaba stock.
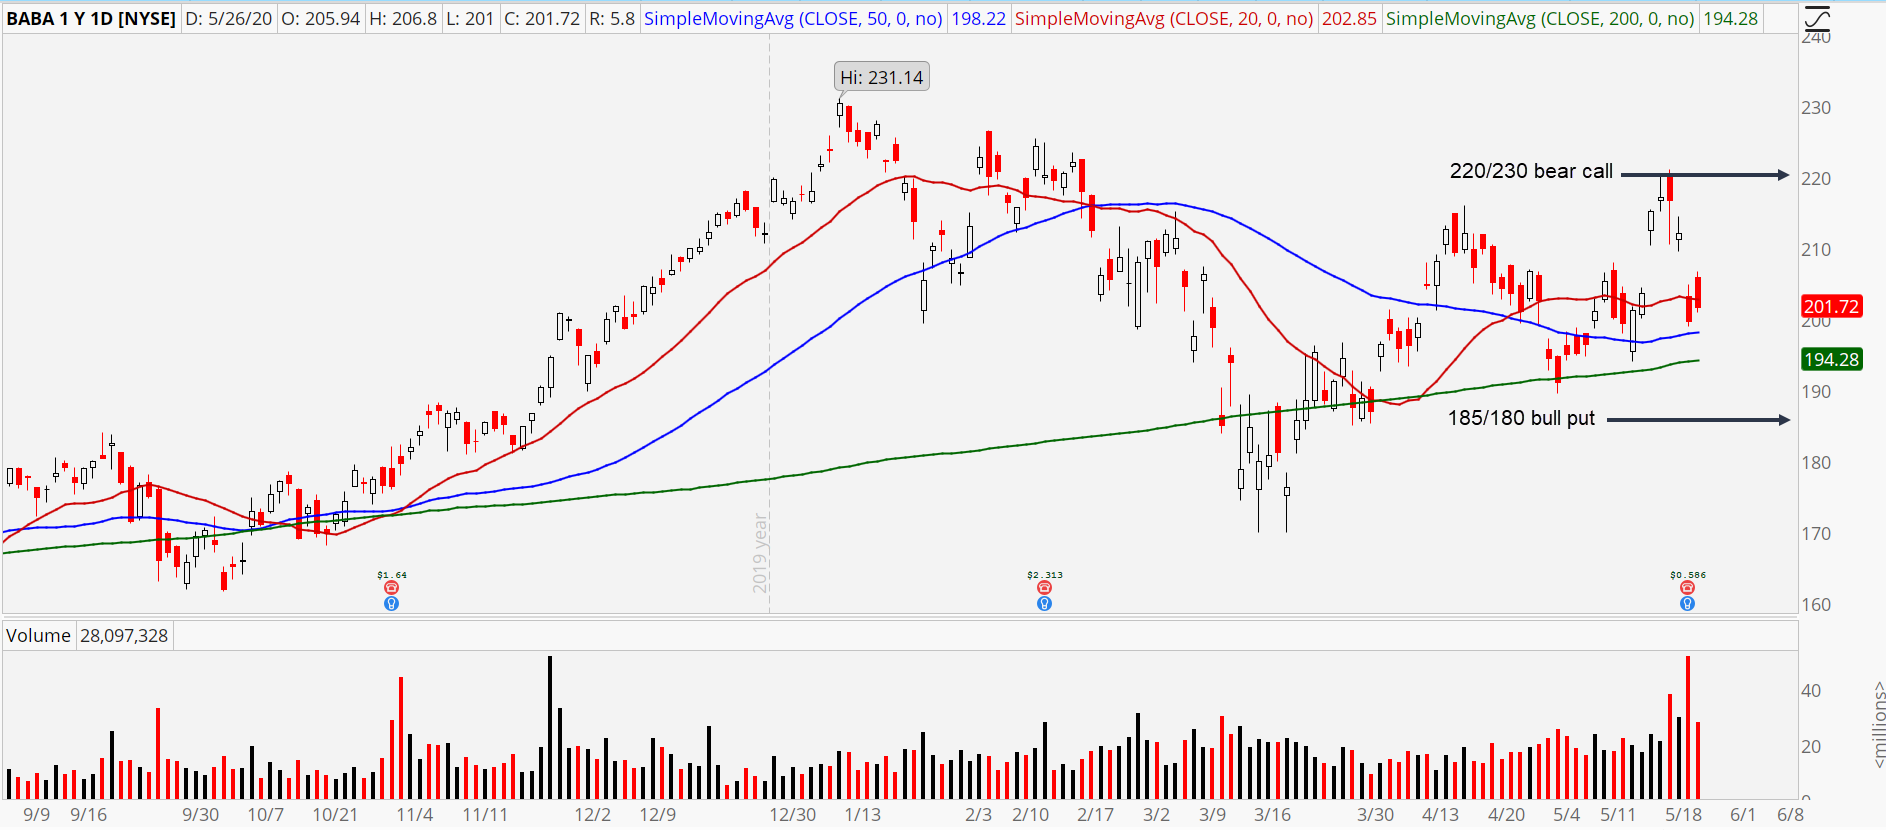
The smaller time frame remains as muddled as the weekly. Just look at the posture of the moving averages. The 200-day, 50-day, and 20-day are all flat as a pancake, making it impossible to declare who has the upper hand. Had I written this last week, I would have favored buyers, because the stock was well above all three smoothing mechanisms. But the earnings drop killed the breakout by thrusting BABA back to the middle of a congestion zone.

Trade Ideas
If you’re intent on making a play here, I have two ideas. Given the absence of a strong directional trend, high probability theta trades are the way to go.
Bulls: If you’re willing to bet BABA stays above $185 by June expiration, then sell the Jun $185/$180 bull put spread for 50 cents.
Bears: If you’re willing to bet BABA stays below $225 by June expiration, then sell the Jun $225/$230 bear call spread for 50 cents.
For a free trial to the best trading community on the planet and Tyler’s current home, click here! As of this writing, Tyler didn’t hold positions in any of the aforementioned securities.