Stocks To Buy After The Buffett Sell-Off
by Alon ZieveSummary
- The airlines sold by Berkshire lost 15.8% in value more than other airlines since the Buffett Sell-off began.
- The Buffett Airlines have less attractive cash valuation metrics than their US peers, but other valuation metrics are similar.
- TSA passenger screens are recovering, but stock prices do not closely track that pattern.
On April 3, 2020, it was reported that Berkshire Hathaway (BRK.A, BRK.B) had sold around 13M of Delta (DAL) shares and 2.3M of Southwest (NYSE:LUV) stock. Later on May 2, 2020, at Berkshire's Annual Meeting, it was reported that Berkshire had fully pulled out of the airline industry. Berkshire had held positions in American (AAL), United (UAL), Delta and Southwest. The Oracle of Omaha has long had a far-reaching impact on the market with his positions. This article looks at the impact on airline stocks of the Berkshire airline sell-off.
In this analysis I looked at three groups of companies. The first group was the "Buffett Airlines." These include:
- American Airline Group
- United Airlines Holdings
- Delta Air Lines
- Southwest Airlines
The second group was comprised of other US airlines not in the Buffett Airlines group. These include:
Note that the Buffett Airlines are generally more premium brands than those in the Other US Airline group.
The third group was comprised of Non-American Airlines listed on American exchanges. These include:
- Ryanair Holdings (RYAAY)
- Deutsche Lufthansa (DLAKF)
- Air France-KLM (OTCPK:AFRAF)
- easyJet (OTCPK:EJTTF)
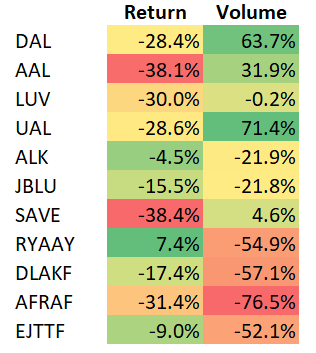
It is hard to know exactly when the Buffett Airlines Sell-off began. However, on April 3, it was reported as in the "previous few sessions." I took March 26 as my reference point, representing the period immediately before the sell-off. I then compared 3 separate portfolios, each equal-weighted between the stocks in each group. The return on the Buffett Airlines portfolio through May 22 was -31.3%. This was a significantly larger loss than both in the Other US Airlines portfolio which returned -19.5% and the Non-American Airlines portfolio which returned -12.6%. The two non-Buffett sets of companies average a return of -15.5%, 15.8% above that of the Buffett Airlines.
I next tried to assess the significance of the Buffett Airlines sell-off on this return. I measured the trading volume of each stock in the 20 trading days prior to March 26 and the 20 days after March 26. Trading volume of the Buffett Airlines increased by 41.7%, compared to the Other US Airlines which decreased by 13.0% and Non-American Airlines which decreased by 60.1%.
This analysis gives a strong indication that Berkshire's sale of airline stock increased the trading volumes, and that with this, selling pressure created negative price movement. Below is the analysis on a per-stock basis.

Source: Alon Zieve
Stocks to Buy among the airlines?
The fact that the Buffett Sell-off depressed Buffett Airlines share price does not make these stocks a buy. To determine which stocks are a buy it is necessary to understand whether the Buffett Airlines were overvalued relative to other airlines prior to the sell-off, or whether valuations were aligned and the Buffett Airlines are now cheap. In addition, it is necessary to take a view on whether the industry will recover, how fast and when.

Source: Seeking Alpha Premium
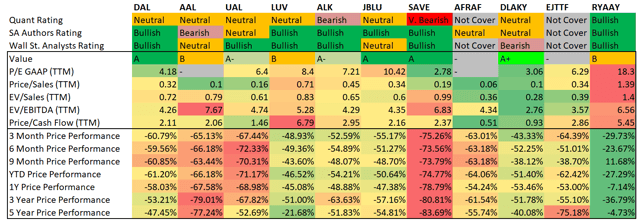
A review of common valuation metrics reveals several insights:
- The valuation metrics above show very little difference between the Buffett Airlines and the Other US Airlines. The one exception is Price/Cash Flow. In this case, the Buffett Airlines are 25% more expensive than the Other US Airlines. As currently cash flow is critical for the airline industry which is burning through cash, this may be the most important valuation metric.
- There is a large variation between the US Airline stocks and the Rest of World Airline stocks. The primary listing of these stocks is not in the US, and the US Stock Exchange has different dynamics. Despite the secondary listing in the US, clear market dynamics resulting from the exchanges are at play here.
- Despite the 11.8% difference in price performance between the Buffett Airlines and Other US Airlines, the two groups of stocks have tracked closely to one another over all windows from 3 months through 3 years. There is a variance in the 5-year price performance where the Buffett Airlines performed 22% better than the Other US group.
- Berkshire Hathaway bought around $10B of airline stock in late 2016. As the Buffett Airlines outperform the Other US Airlines on a 5-year window, but have similar performance 3 years onwards, it appears that Buffett's position pushed the stocks up, and his exit pushed them back down.
Airlines appear to be restarting
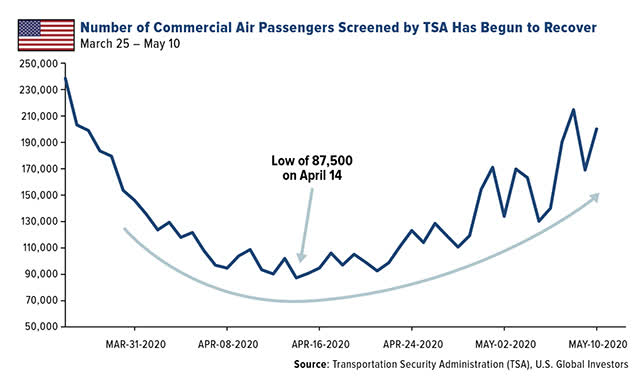
One other extremely important data point if considering investing in airlines is the daily number of flights and passengers. One important data point is the number of passengers screened by TSA. The below graphic taken from GROW Press Release indicates a strong recovery from a low in mid-April.

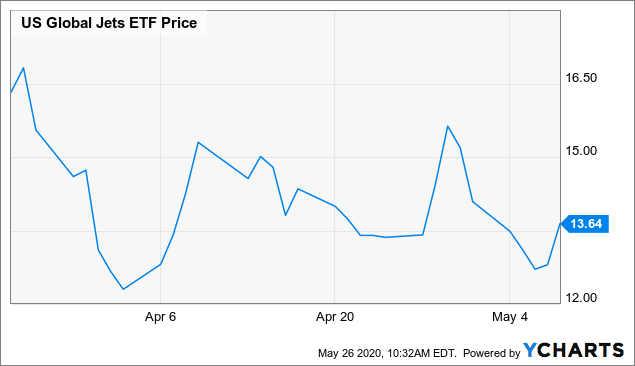
Compare this to JETS, an ETF that tracks the airline sector.

Data by YCharts
The stock prices are not following the pattern of the flights' recovery. This may well be a buying opportunity.
If you liked this article please "Follow" me by clicking the button at the top of the page.
Disclosure: I/we have no positions in any stocks mentioned, but may initiate a long position in JBLU, ALK over the next 72 hours. I wrote this article myself, and it expresses my own opinions. I am not receiving compensation for it (other than from Seeking Alpha). I have no business relationship with any company whose stock is mentioned in this article.