Microsoft: On The Edge
by Oleh KombaievSummary
- Analysts remain optimistic about Microsoft. Now it’s rare enough.
- MSFT's price is now balanced relative to the main blue chips on Nasdaq.
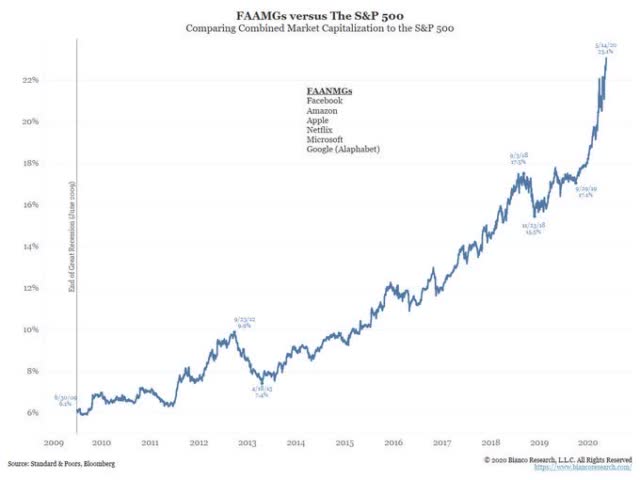
- The capitalization of the FAANMG companies now accounts for almost 25% of the total capitalization of the S&P 500 index.
- The largest stock in the S&P 500 is now Microsoft. A similar situation was already observed in 1999.

I will start with a quantitative analysis and then move on to a qualitative one.
Long-Term Trend
The last ten years, the dynamics of Microsoft's (MSFT) stock price has been following its long-term exponential trend that acts as a specific average:
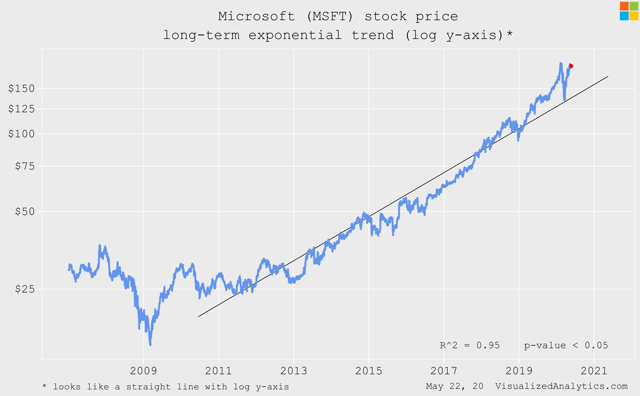
Now the company's stock price is above this trend by two standard deviations:
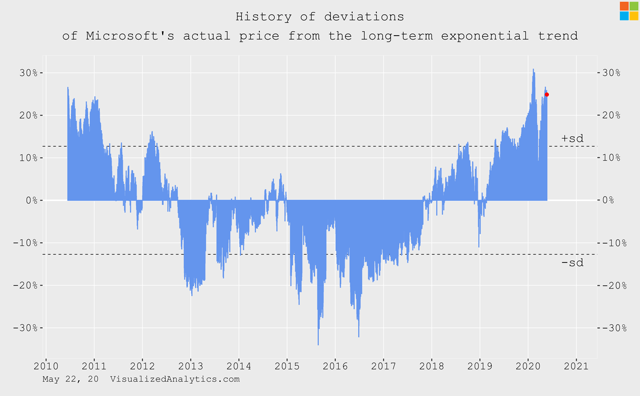
It means that MSFT's stock price has been growing faster than the exponential trend. Generally speaking, it indicates an unstable growth rate.
Estimates
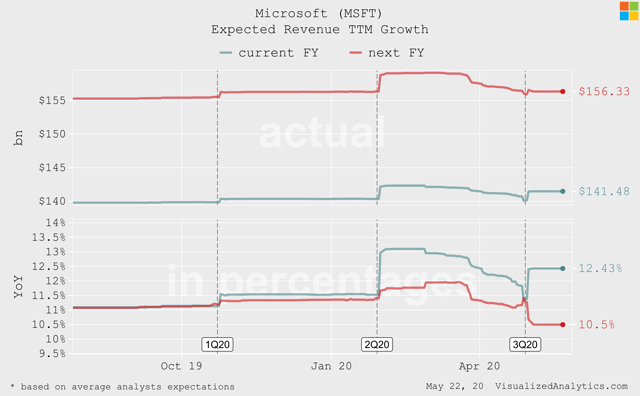
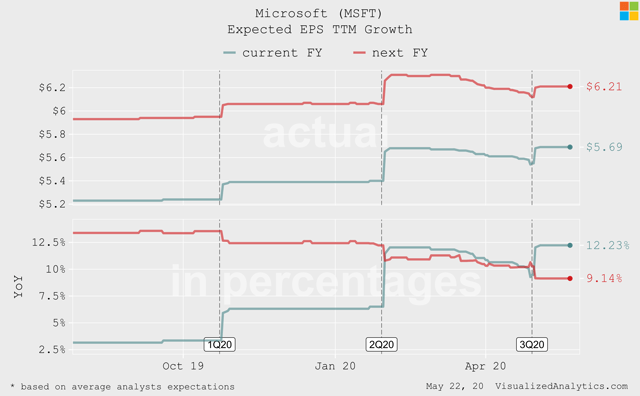
After the last quarterly report, the average expectations of analysts regarding the growth of the company's revenue and EPS in the current fiscal year have increased. In general, it is worth noting that analysts remain optimistic about Microsoft. Now it’s rare enough.
Drivers
Let's start with revenue.
Over the last ten years, Microsoft's capitalization has been in a qualitative linear relationship with its absolute revenue TTM:
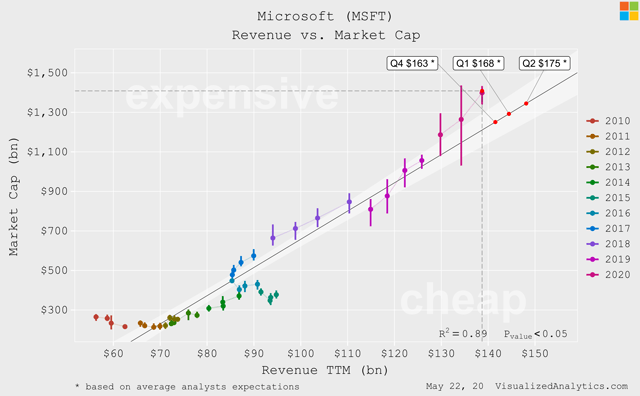
As you can see, this relationship identifies MSFT's current capitalization as overvalued.
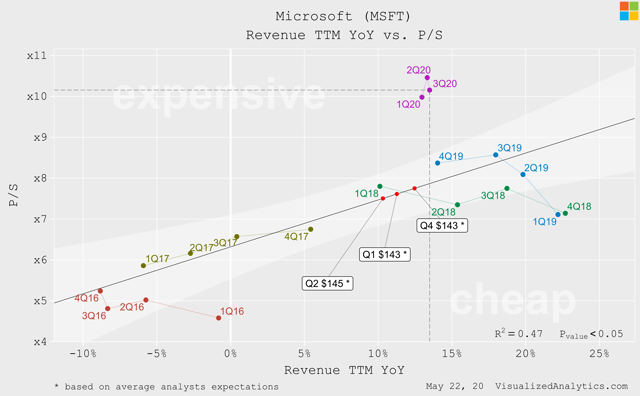
Microsoft's revenue growth rate and the company's price, reflected by the P/S multiple, also are in direct relation. And here we can even consider different time horizons.
Considering only the last five years, the current growth rate of revenue does not justify the achieved level of Microsoft's P/S multiple:
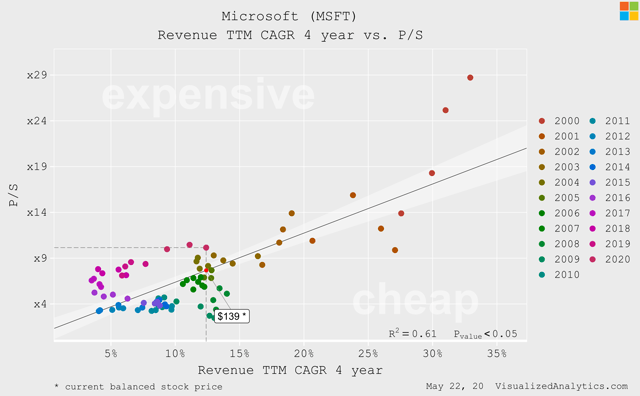
If you look at Microsoft over the past 19 years and analyze the interdependence between P/S and 3-year revenue CAGR, you’ll see that the current level of the multiple is also substantially above the balanced state:
Based on the long-term relationship between the EPS TTM absolute size and the company's capitalization, Microsoft's current price is overvalued too:
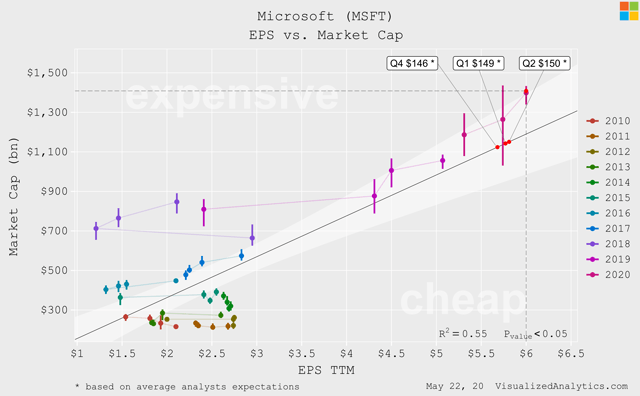
Moreover, according to analysts' average expectations, in Q4 2020, MSFT's EPS TTM will be lower than now, and in my model, this means that the company's rational stock price will come close to $150.
Having considered the long-term relationship between Microsoft's EBITDA growth rate and its EV/EBITDA multiple, it should be recognized that the current ratio of the multiple is balanced:
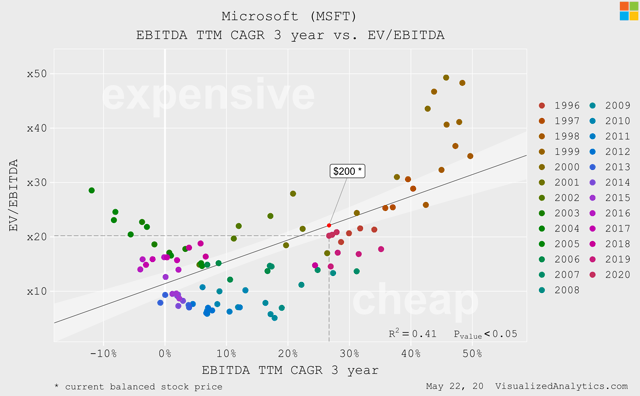
From the point of view of the established patterns between the parameters of the financial performance of Microsoft and its price, I am inclined to conclude that the company is overvalued.
Comparable Valuation
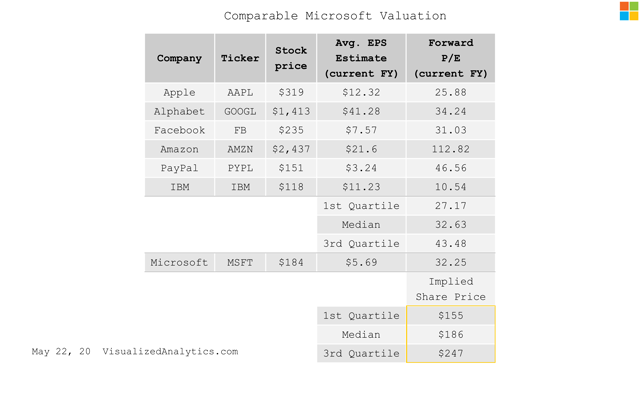
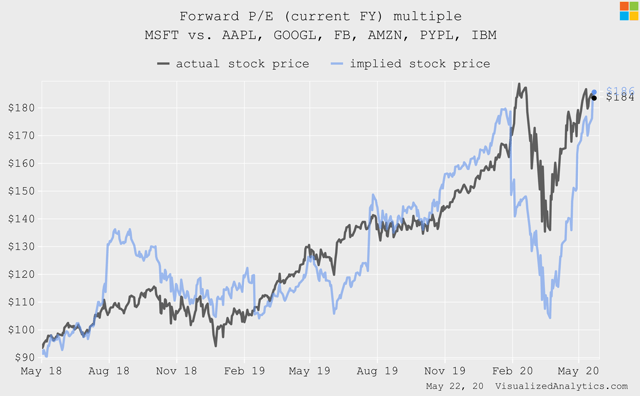
Judging by the Forward P/E (current FY) multiple, Microsoft's stock price is now balanced:
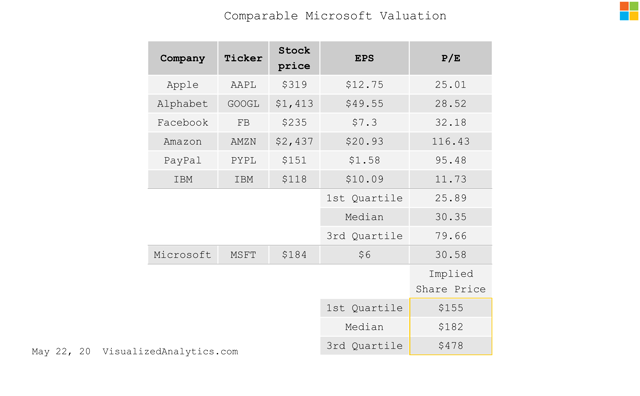
The same is true for the P/E multiple:
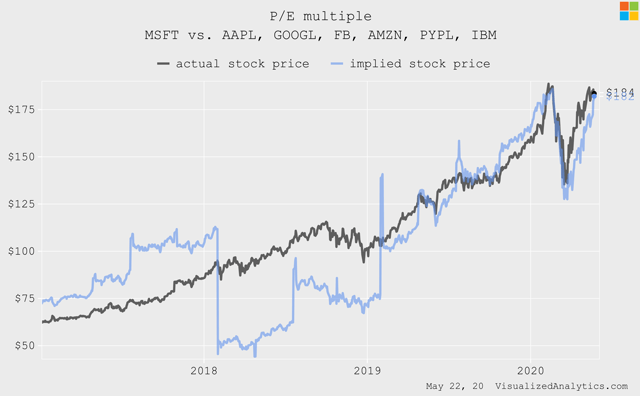
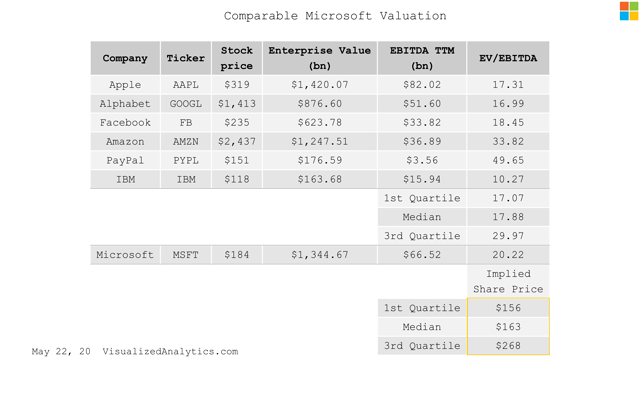
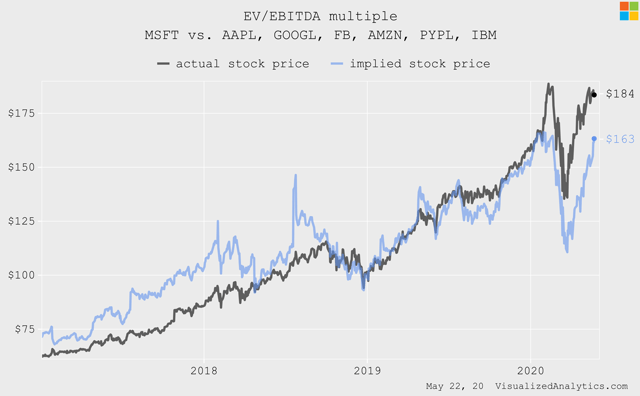
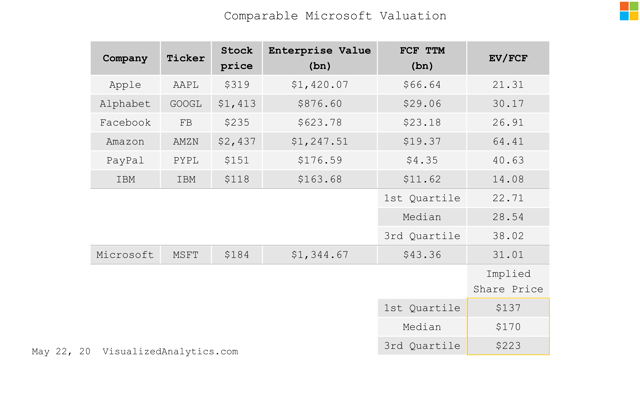
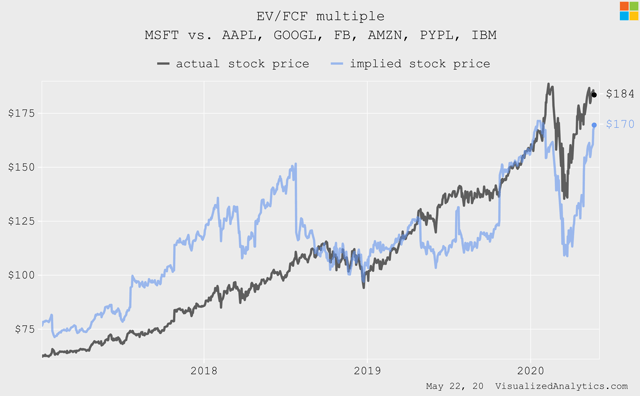
At the same time, judging by the multipliers that I tend to trust less, the company is now relatively expensive.
EV/EBITDA:
EV/FCF:
EV/IC:
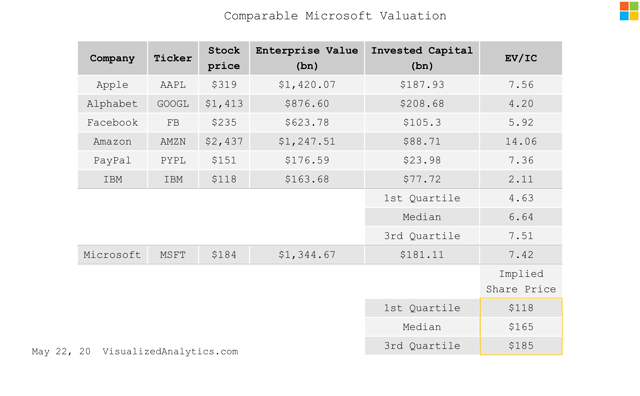
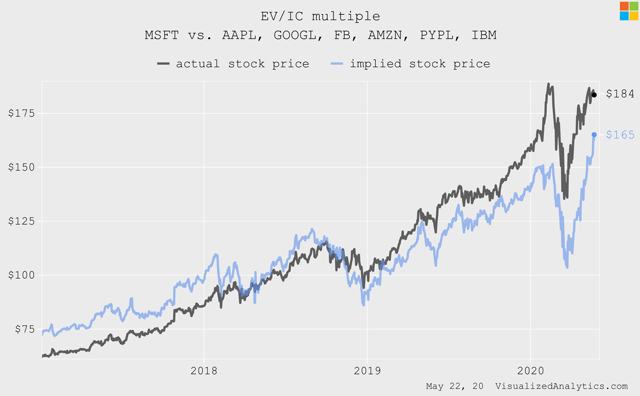
In terms of the comparable analysis, Microsoft's price is now balanced relative to the main blue chips on Nasdaq.
Sentiments
I like Microsoft. I always liked it. Good management. Good revenue diversification. Good long-term investment. The only thing I don’t like is the dynamics of Microsoft stock price over the last several quarters. And now this feeling is especially strong.
The capitalization of the FAANMG companies now accounts for almost 25% of the total capitalization of the S&P 500 index. Think about it, a quarter is just six companies:
And what do you think is the largest stock in the S&P 500?
Yes, Microsoft:
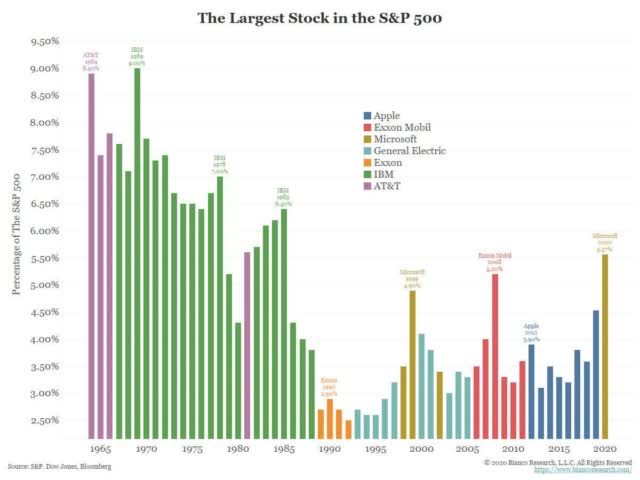
By the way, a similar situation was already observed in 1999. Let me remind you how it ended for Microsoft then:
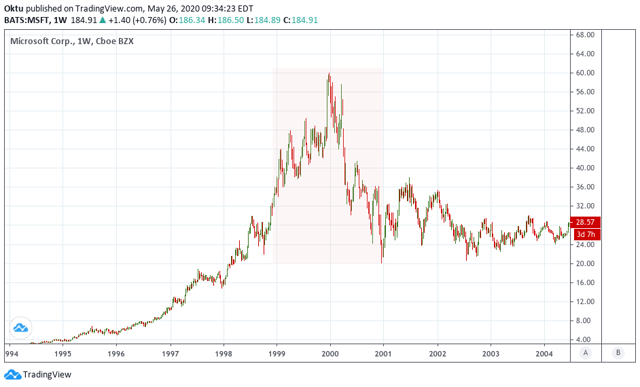
You see, Microsoft is a great company, but the market has overheated it. And it is dangerous for the capitalization of the company.
Also, I want to note that in the "Comparable Valuation" block, I stated that Microsoft is now balanced relative to the main blue chips on Nasdaq. But, as I have already shown, these blue chips are also overheated now.
So, for now, I stay bearish on Microsoft.
Disclosure: I/we have no positions in any stocks mentioned, and no plans to initiate any positions within the next 72 hours. I wrote this article myself, and it expresses my own opinions. I am not receiving compensation for it (other than from Seeking Alpha). I have no business relationship with any company whose stock is mentioned in this article.