Investing With Leverage - What You Need To Know
by Eng Guan LimSummary
- Leverage fluctuates on a day to day basis unless actively managed.
- Leveraged performance is path dependent.
- Doubling leverage does not double CAGR but it does double volatility.
- Excessive leverage can diminish returns.
- The right amount of leverage to use depends on multiple factors including the long-term average return of your strategy, its volatility, tail risks, your own risk tolerance, and target returns.
Leverage, in the wrong hands, is a recipe for disaster. To draw a parallel, it is like putting a gun in the hands of a novice and asking him to fight. In all likelihood, he is going to end up shooting everyone, friend or foe, including himself. As for leverage, it turns into a time bomb in the hands of people who are driven by greed, or who don’t understand how it works. In order to use leverage safely, you need to know the math behind it and the risks involved. Thus, if you are one of those who have no intention of doing proper homework, then heed my advice, steer clear of leverage.
Understanding the Nature of Leverage
Many misconceptions about leverage abound. The results of implementation may be far from what you envisage. Hence, before we look at how to make good use of leverage, let’s try to understand the nature behind it.
1. Borrowing comes at a cost
Nothing in the world comes for free, in particular, when it comes to borrowing money. You can choose to leverage through margin accounts, leveraged products, or borrowing funds elsewhere. But no matter what you do, there will be a cost tagged to it whether directly or indirectly. While borrowing costs have come down since the Great Financial Crisis (GFC) in 08-09, it is nevertheless still a hit to your pocket. And you pay it regardless of whether your investments made or lose money.
For those who are trading through a margin account, brokers typically charge you a daily interest calculated based on some reference rate plus a spread. The reference rate depends on the currency you borrowed in. For example, USD borrowing often uses the overnight LIBOR rate or the effective fed funds rate. The spread charged differs from broker to broker and can be tiered according to how much you borrow. Basically, the more you borrow, the lower the spread. To give you a general sense, below is a table showing you each year’s average Overnight LIBOR + 1.5%.
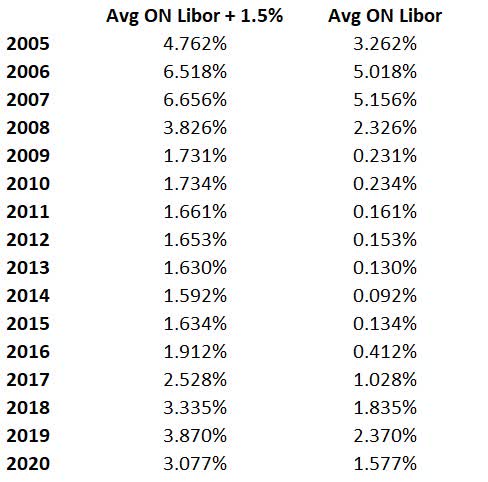
In a high-interest rate environment, the drag from financing costs can be significant. As an example, in 2007, if you borrowed $100K, you would be charged a daily interest of around $100K x 1/365 x 6.656% = $18.24.
2. Leverage fluctuates on a day to day basis unless actively managed
I would not be surprised if most people who use leverage just implement it when they first execute the trade. After that, they leave the position untouched until as and when they decide to close it. In the meantime, they expect their day to day return to be a multiple of the underlying securities’ move. That means if they use 2x leverage, they expect to get 2x the daily return. And if they use 3x leverage, then 3x the daily returns and so on. That might hold as an approximation over short periods in the absence of drastic moves. But over longer periods, the results can be very different.
Gains lower your leverage and losses increase it. As an illustration, let’s consider a case where you have $10,000 which you leveraged up by 2x to $20,000 to buy securities. Let’s also leave financing costs out of the picture for now. So the Net Liquidation Value (NLV) of your portfolio each day comprises of -$10,000 which you borrowed, and whatever your securities are worth then. From here, to get your leverage at the end of each day, you just need to take your total exposure which is measured by the value of your securities and divide that by the NLV of your portfolio. Let’s see how this turns out for 2 scenarios – (1) Positive Daily Returns, (2) Negative Daily Returns

Leverage Decreases When Returns Are Positive

Leverage Increases When Returns Are Negative
As you can see, leverage does not stay fixed. To maintain it, you need to actively adjust the size of your positions. You need to buy into gains and sell into losses. If we view it purely from an arithmetical perspective, you did make or lost twice the dollars or returns over the entire period of 7 days. However, that does not translate to making or losing twice the daily unleveraged return. Why? Because daily returns are compounded and the NLV of your portfolio is growing or losing at a faster rate than the value of the securities you hold.
3. Leveraged performance is path-dependent.
How your investments move or how volatile it is has a big influence on how leverage performs.
Assume you have 2 products: (1) Actual SPY, (2) Riskless SPY. Actual SPY, is as the name implies, the real SPY ETF. Riskless SPY, on the other hand, is a fictional version of SPY that grows at a fixed rate every day. Both deliver the same Compound Annual Growth Rate (CAGR) of 9.156% from the period 1993 – 2020. For a clearer picture, see the chart below.
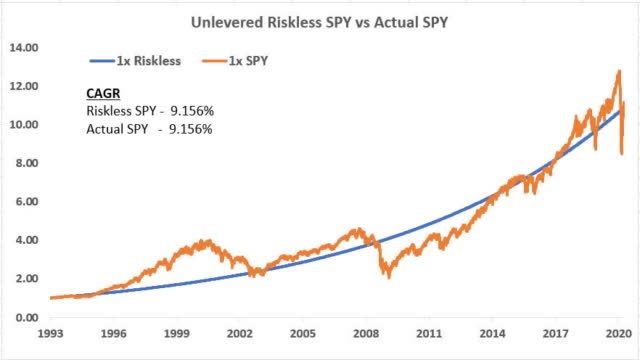
Unleveraged Riskless SPY Vs Actual SPY
Now, how would a 2x leveraged version of these 2 products perform? Let’s say we actively managed the leverage to maintain it at 2x at the end of each day. And to make it more realistic, let’s also include a transaction cost of 0.05% and a financing cost of US Overnight LIBOR + 0.5% which is closer to what institutions are charged. For US Overnight LIBOR, I used its yearly average as an estimate for the daily rates. Many will be quick to jump to the conclusion that both should give you the same results. But sorry to disappoint anyone who thought that is the case because things just don’t work this way.
Leverage favors strategies that have low volatility, low losses, and trends up more frequently. You get to more effectively compound positive returns with lesser drag from the losses. So Riskless SPY is like a perfect candidate. It moves up every single day. As a result, it outperforms Actual SPY by a wide margin. Unfortunately, in a real world, Riskless SPY exists only in your dreams. If not, everyone would have borrowed up to the max and invest all their money in it.
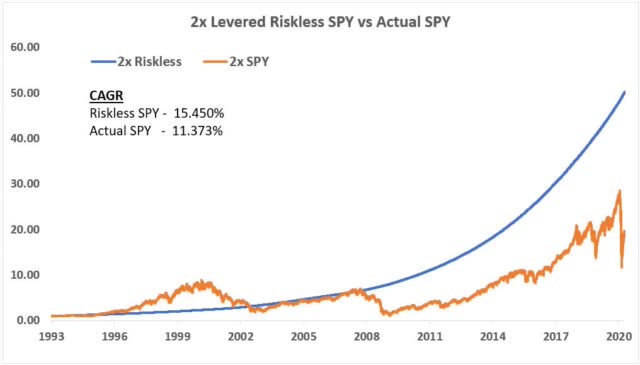
Leveraged Performance of Riskless SPY Vs Actual SPY
4. Doubling leverage does not double CAGR but it does double Volatility.
There are those who held the misconception that the long term CAGR of an investment strategy increase by a multiple of the leverage used. That is not true. If you are sharp enough, you will notice in the earlier chart that doubling the leverage of SPY did not double its corresponding CAGR. It is not that leverage is incapable of increasing CAGR by its multiple. Mathematically, that and beyond is possible. But realistically, it is very unlikely, unless Riskless SPY exists, brokers become charitable and financing is free of charge. So in practice, the leveraged CAGR of your strategy will not be anywhere near its multiple.
Going back to the earlier example using the period from 1993-2020, a 2x SPY gives a CAGR of 11.373% against an unleveraged CAGR 9.156%. That is only around 1.24x and not 2x that some people expect. On the flip side, it does, however, doubles the volatility of your strategy from 18.89% to 37.79%. So leverage tends to reduce risk-adjusted measures like Sharpe Ratio. This is something to bear in mind.

Leverage – CAGR & Volatility
5. Excessive leverage can diminish returns.
Now, some of you might think that not giving the full multiple is alright because I can always increase the leverage until it hits my desired long term return. If 2x is not enough, I will do 4x, 5x or more. This is a dangerous line of thinking. Let’s use back SPY from 1993 to 2020 as an example and for the sake of illustration, I assume a couple of things:
- The broker is able to extend to you any leverage you want.
- There is no margin call.
- You start with $200,000
- SPY can be bought and sold in infinitely small fractional units.
From the chart below, you can see that the CAGR and NLV as at the end of the period in 2020 start tapering off after leverage hits between 2.0 – 2.5. It doesn’t just keep going up and up. In fact, your CAGR goes negative after leverage goes past 4.5.
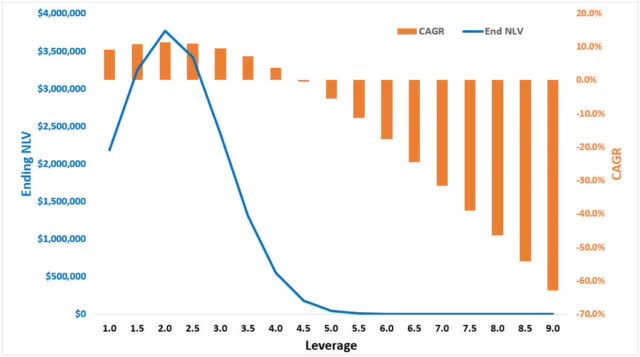
Excessive Leverage Lowers Returns
Why is that the case? Because leverage, being a double-edged sword, magnifies your losses as well. The deeper these losses run, the harder it is for the strategy to climb back up. A conservative loss of 10% requires a fairly close gain of 11.1% to fill the gap. An enormous loss of 95%, on the other hand, means a long and steep climb of 1900% before your investments recover. SPY, when unlevered, already experienced a large drawdown of more than 50% during the GFC.
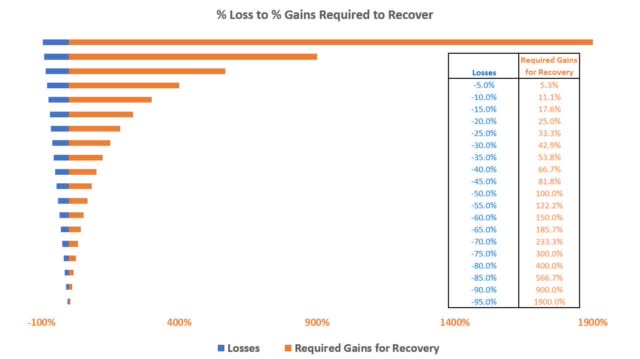
Loss To Gains Required For Recovery
I know some people find it easier to relate in terms of dollars and cents. In that case, you just need to imagine you invested a $1000 into an investment that turns sour leaving you with only 50 bucks. Now, go and grow this 50 bucks back to a $1000. Most would give up. Commercial funds, in particular, would have closed shop long before they even reach there.
The tipping point where returns start falling will, however, vary for different strategies depending on their average returns, volatility, interest rates, and path of the strategy. Of course, we got our numbers in hindsight. These are backtested and we have no means of knowing what the future holds. But it is nevertheless still a good reference to work on.
What Are The Things We Should Look At For Leverage?
We have all heard stories about investors using leverage only to end up having their accounts wiped clean. That is an expected outcome for anyone who blindly and blatantly applies leverage, particularly, on high-risk strategies in the pursuit of returns. But despite all its shortcomings, leverage is a useful tool if we use it conservatively on the right candidate.
For me personally, the right amount of leverage depends on multiple factors including the long-term average return of your strategy, its volatility, tail risks, your own risk tolerance, and target returns. To get answers, we need to be able to model or backtest the strategy over a period covering a full market cycle or more, so that we can observe its behavior and performance under different market conditions.
1. CAGR should be decent.
You don’t need eye-popping returns here, but you do need a decent return. What do I mean by decent return? It means your strategy should have a long term CAGR with a sufficient margin above your financing costs. If you can’t even beat that, then don’t bother. Neither does it make a lot of sense eking out only an additional measly 1% or so while doubling or tripling your leverage. Because the risk-reward just isn’t appealing. And note that in the examples I shown earlier, I am using USD ON LIBOR + 0.5% which are lower than what most people would be paying. On top of that, higher leverage means your tail risks just got larger. We will touch on that in a while.
2. Volatility should be low.
The performance of leveraged investments depends not just on the returns. Volatility plays a part as well. The relation is less apparent, but in general, volatile investments tend to have huge swings and larger losses. With leverage, these get amplified and works against you over the long run.
There are those who use volatility to determine the optimal leverage using a quantitative formula derived from the Kelly Criterion.
optimal leverage = ( return – risk free rate ) / variance
As an example, you can use the daily return of your strategy against its daily borrowing costs. The numerator gives you the excess return your strategy makes. The denominator is the variance of the daily return which is mathematically just the square of the daily volatility. But there are issues if you strictly stick to what is recommended using this formula because it tends to suggest a level that is too high to operate safely.
Why? First of all, there will always be estimation errors, and when we deal with leverage, our tolerance for errors shrinks. Next, standard measures such as volatility fit everything onto a normal distribution assuming symmetric distribution and grossly understates tail risks, which we see happening way more often than what typical normal distribution implies. A tail event is bad enough, add leverage to it, and that can be all it takes to ruin everything.
3. Maximum drawdown should be low.
There are no reliable ways to model tails. So this is the part where we need to exercise some discretion. We make do with what we have and what we know. A useful metric to look at is the Maximum Drawdown (largest historical loss ever) experienced by the strategy. For this to be of any meaning, please use a sufficiently long period that captures different market cycles and scenarios so that the strategy has the opportunity to show not just its strength, but more importantly, its weakness. It is pointless to tell me your long-only stocks or writing put options strategy did very well with exceptionally low drawdown when you only run it in a stable bull market. Because then we are only seeing the good side of things, and unsurprisingly, nothing will kill you. But what we want to know is what can kill us.
Maximum Drawdown gives us a sense of what can hit us in a really bad scenario. The larger the maximum drawdowns, the lower the scope for leverage. Because it will tip your leverage into the point of diminishing returns faster. You may recall in the example on SPY, the return falls after leverage hits past a factor of 2. Of course, the implicit assumption here is that the same shit can happen again. And why not? The exact same event might not repeat, but something else can always trigger another drawdown of the same magnitude or worse.
4. Largest intraday day loss should be low.
This one is often overlooked if your historical backtest runs from the market close to close. Intraday swings can extend much further either direction. Huge moves are entirely possible. One of the most famous examples is Black Monday. On 19 October 1987, S&P 500 plummet more than 20% in a single day. If the price drop happened on the market open, you would have no time to exit your positions. And if you are more than 5x levered, you would have lost every single cent and more. If you do not have intraday information about your strategy, you can try to simulate the worst case.
5. What is your own psychological loss limit?
This is something only you can answer. And if you have never been tested, you may not even know yourself. This is the threshold for the pain of loss beyond which you start to lose your cool and panic. For some it can be as low as 10%, some 20%, and the more aggressive ones 50% or higher. Whatever it is, at that point, you start to act irrationally and do stupid things that were not part of your plan, if you even have one in the first place. Leverage can accelerate your path there. So if you don’t ever want to be there, then make it difficult to reach there.
Case Study – A Risk Parity Strategy
We can only know the appropriate size of leverage to take after modeling the strategy and gathering the information we need. Each one is different. Your own risk preference differs from others as well. So there isn’t a one size fits all solution. For more clarity, let me take you through a case example for a long-only risk parity asset allocation strategy that was tested over a 15 year period from 2005 to 2020. Below is a summary of its unleveraged performance, and for the purpose of comparison, I included SPY.

CAGR Check – Passed
It yielded a reasonably good CAGR of about 8.2% unlevered. This is comparable against the return from the SPY ETF over the same period. Now, if we contrast it against the average financing cost over the period, it also fared well, delivering a positive margin of over 5%. Note that this is considering the fact that I applied a higher spread of 1.5% here.
Volatility Check – Passed
The annual volatility is very low at 6.8%. (< 10%). This is like a third of SPY’s volatility. So the day to day fluctuations of the Risk Parity strategy is much more stable and measured. This makes it a more suitable candidate to carry leverage.
Maximum DrawDown – Passed
The largest historical loss comes in at -13.7%. Again, this is way lower than the -55.2% SPY experienced. If you recall, the required return to recover the loss increases dramatically as the drawdown gets deeper. So in this aspect, the risk parity strategy has a wider scope to use higher levels of leverage.
Maximum Intraday Loss – Passed
As for the maximum intraday loss, I adopted a worst-case approach in the computation. I assumed on each day, the securities held by the risk parity strategy all closed at its low. In practice, it is highly unlikely all securities are going to hit its low at the same time. Even with that, the worst intraday loss over the period is just -4.7%. Theoretically, this means you need a leverage of 21x to wipe this account clean or beyond on its worst day. SPY, on the other hand, faced a loss of -11.9%. And if we extrapolate back to 19 October 1987, Black Monday, this intraday loss will balloon to -20% (note: SPY incepted only in 1993 but we can use S&P 500 as the proxy).
Taking Into Account Target Returns & Risk Tolerance
Now, let’s bring on board my target returns and risk preference. I want to aim for a long term CAGR between 10%-15% while limiting my loss to no more than -30% (max drawdown). To find out the leverage I should use, I need to know how my returns and drawdowns look like with different levels of leverage. See the chart below.
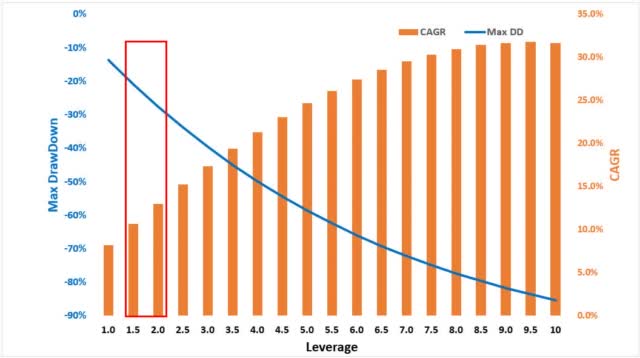
CAGR & DrawDown With Increasing Leverage
As you can see, this strategy can stomach up to 9.5x leverage before exhausting the benefits. This is of course based on historical results and it can change depending on the path the strategy takes. But in any case, we are not looking that far. The leverage sweet spots I should be targeting are between 1.5 and 2.0 which is captured in the red box. This is the zone where I satisfy both my CAGR and loss limit criteria.
I tend to lean on the conservative camp and as an added measure of precaution, I like to work with the expectation that we have yet to see the worst. So I want to set some buffer between the maximum drawdown and my loss limit. This gives both me and the strategy more room to maneuver so that we will not prematurely terminate, or deleverage a good strategy. Hence, a leverage between 1.5x – 1.7x where the largest max drawdown is 23% looks more acceptable.
This is nowhere near the 21x leverage needed to burn me to a crisp during a bad day. It is also nowhere near the 13.2x suggested by Kelly Criterion. Neither is it anywhere near the 9.5x before the leveraged return starts falling. It is a much lower and conservative 1.5x-1.7x which can be implemented by small investors with a normal margin account without needing the use of futures, options, or other leveraged products. Let’s see how things look like with 1.7x leverage.
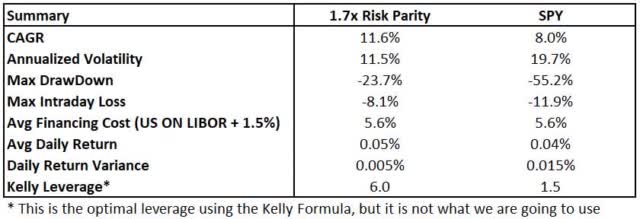
At a simple glance, we can see that even with leverage, the strategy still operates at a lower risk than SPY despite delivering higher potential returns. That is where the power of leverage comes in when you pair it with the right partner.
Some Other Things To Note
In this post, I assumed we actively maintain a constant leverage every day. In practice, you don’t have to, especially if the transaction cost is a concern. You can adjust the portfolio only when leverage deviates beyond a certain threshold. Depending on how the investments performed and the leverage you are taking, you can also do it over a longer time frame, maybe once a week, once a fortnight or once a month, etc. There are also others, in particular those in institutions, who prefer to size their positions according to a specific volatility target rather than a fixed leverage factor. In that case, the leverage of their portfolio will fluctuate every now and then. But whatever you choose to do, remember to do your homework.
Conclusion
For those who are new to leverage, I hope you learn a few things after reading this. Leverage is but a tool. Yes, it can help, but it can also kill. Ultimately, what it does hinges on how you use it.
Disclosure: I/we have no positions in any stocks mentioned, and no plans to initiate any positions within the next 72 hours. I wrote this article myself, and it expresses my own opinions. I am not receiving compensation for it. I have no business relationship with any company whose stock is mentioned in this article.