Galiano Gold: Digging Into The Q1 Results
by Taylor DartSummary
- Galiano Gold reported its Q1 results earlier this month, reporting quarterly gold production at its Asanko Mine JV of 66,300 ounces.
- While all-in sustaining costs for the quarter came in at record levels of $805/oz, they are still expected to come in near the guidance mid-point of $1,050/oz for FY-2020.
- The good news is that operations are clearly improving at the Asanko Mine JV, but I continue to see far better African producers out there with higher margins.
- Therefore, while a rising gold price may lift Galiano Gold, I see better opportunities elsewhere, given the company's industry-lagging margins, and sub-par operating jurisdiction.
We're more than three-quarters of the way through the Q1 earnings season for the Gold Miners Index (GDX), and we've seen a mixed start to the year, with the Australian miners putting up the most impressive results, and many miners operating in North America falling short of expectations. While Galiano Gold (GAU) is not an Australian miner, the company did put together a solid quarter in Q1, with a new record low for all-in sustaining costs and a solid quarter of production from its Asanko Mine Joint Venture [JV] in Ghana. Despite the COVID-19 challenges, Galiano is well ahead of its FY-2020 guidance mid-point of 235,000 ounces of gold production, a positive sign. However, while costs came in quite low this quarter, they are still expected to come in above $1,000/oz for FY-2020. Based on the company's industry-lagging margins vs. African gold producer peers and much smaller production profile, I continue to favor other African names over Galiano Gold.
(Source: Company Presentation)
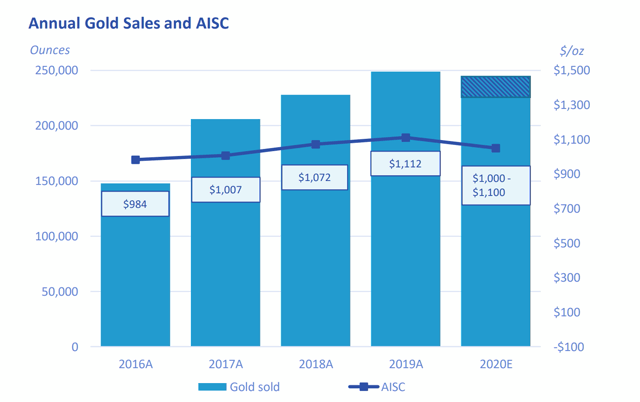
Galiano Gold released its Q1 results earlier this month and reported quarterly gold production of 66,300 ounces from its Asanko Mine JV with Gold Fields (GFI) in Ghana. This production figure was flat sequentially from the Q4 2019 results, but costs dropped by 17% on a sequential basis, with all-in sustaining costs coming in at $805/oz. This has put Galiano Gold in a solid position to beat its FY-2020 guidance of 235,000 ounces at all-in sustaining costs of $1,050/oz. It has also helped to bolster the company's balance sheet to $55 million, or more than 10% of the company's market capitalization in cash. Let's take a closer look at the operations below:
(Source: Company Presentation)
During the quarter, the Asanko Mine JV benefited from an average mill head grade of 1.60 grams per tonne gold, a 7% improvement sequentially from Q4 2019, and gold recoveries continued to remain stable at 94%, well above the plant design. This solid mill performance helped the company to deliver exceptional Q1 production results of 66,300 ounces, on track for more than 240,000 ounces of gold production in FY-2020, and a moderate beat on guidance if this performance continues. The real story in the quarter that may be exciting investors is the significantly lower costs, with all-in sustaining costs dropping to $805/oz, down 17% from Q4 2019, and nearly 20% below the industry average. However, it's important to note that guidance was reiterated at $1,000/oz to $1,100/oz for costs, and extremely low capital expenditures in Q1 were a big help to driving costs lower. Therefore, while Q1 was a solid quarter from a cost standpoint that drove significant margin expansion, it's not expected to last. We can take a closer look at this below:
(Source: Author's Chart)
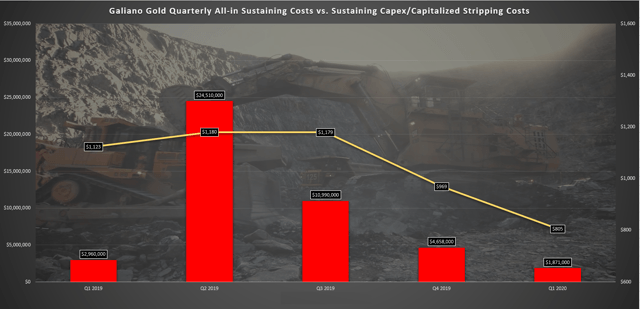
If we look at the chart I've built of all-in sustaining costs at the mine vs. sustaining capital expenditures and capitalized stripping costs, we can see that all-in sustaining costs have been trending lower the past few quarters. However, this is directly in line with the amount of sustaining capital expenditures spent each quarter. While Q1 2020 marked the lowest all-in sustaining costs to date at the mine, it also marked one of the least capital-intense quarters for sustaining capital expenditures and capitalized stripping costs at the mine. As we can see, this figure came in at just $1.87 million in Q1 2020, down 59% from the $4.66 million in Q4 2019. Therefore, while these costs look great and are indeed quite respectable compared to an industry average of $980/oz, it's important to note that they are not going to last, and investors shouldn't think this is the new normal.
(Source: Company Presentation)
As noted in the Q1 call, the company will be completing the next raise of its tailings storage facility in Q2 and Q3 and will also be completing pre-stripping at the Akwasiso and Esaase pushing costs much higher in the following two quarters. Based on these initiatives, I would expect all-in sustaining costs to move back above $1,000/oz for the next two quarters. The good news is that the gold price strength will offset any significant jump in costs throughout the remainder of 2020. Still, on a comparative basis, there's no reason to get elated about a $1,000/oz plus cost producer in a tier-3 jurisdiction when most gold producers in Africa are producing gold below $900/oz.
(Source: YCharts.com, Author's Chart)
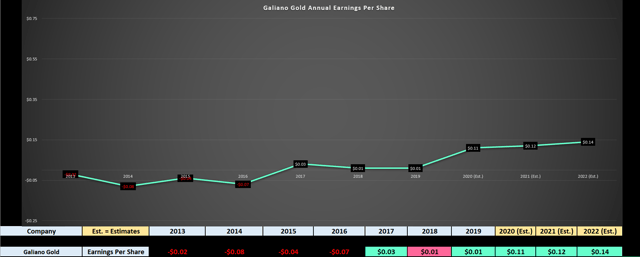
Moving over to the company's growth metrics, we can see that annual earnings per share (EPS) was flat year over year at $0.01, but is expected to soar by nearly 1000% this year. This surge in annual EPS is being helped by the much higher gold price and slightly lower costs. This jump in the gold price drove massive expansion in all-in sustaining cost margins in Q1 alone, with all-in sustaining cost margin jumping 48% from $496/oz in Q4 2019 to $737/oz. Based on FY-2020 estimates of $0.11, we will finally see an earnings breakout year for Galiano Gold, and the company currently has one of the highest earnings growth rates in the sector based on this high triple-digit earnings growth rate. However, generally, I significantly discount earnings growth that's up against a prior year of a nickel or less in annual EPS as it's much easier to drive earnings growth from low levels and easy year-over-year comps. Therefore, while this earnings growth is impressive, it looks much more impressive than it should against a penny per share in annual EPS the year prior.
If we look ahead to FY-2021 estimates, we can see that the annual EPS growth is expected to continue, with forecasts currently sitting at $0.12. This suggests that this surge in annual EPS is sustainable, with these estimates mostly based on the company's initiative to lower costs by $100/oz over the next couple of years as well as the higher gold price the company is working with vs. 2019. While many investors may think that Galiano Gold is insanely undervalued at barely 12x forward earnings given that it's trading at $1.20 per share with $0.11 in expected earnings, it's worth noting that this isn't exactly true. We can take a closer look at some peers below and their valuations to explain this better:
(Source: Author's Chart)
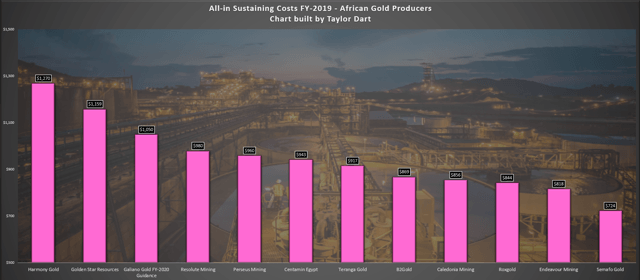
Before digging into valuation, it's important to compare Galiano Gold to other African gold producers to get a better idea where the company sits compared to its peers from a margin standpoint. As we can see from the chart above, Galiano Gold is currently ranked 9th out of 12 African producers from a cost standpoint, and the average all-in sustaining costs for African producers in FY-2019 came in at $940/oz, more than 4% below the industry average. Given that Galiano Gold's FY-2020 cost guidance is 10% above this figure at $1,050/oz and the company is in the back of the pack, we would expect a slightly discounted valuation compared to peers. This is especially true considering that the company is a much smaller gold producer than average compared to its peers, as it's barely a 120,000-ounce annual gold producer based on 50% of production from the Asanko Mine JV. However, as the valuation comparison shows below, Galiano is actually trading at a premium valuation to US-listed African gold producers.
(Source: YCharts.com)
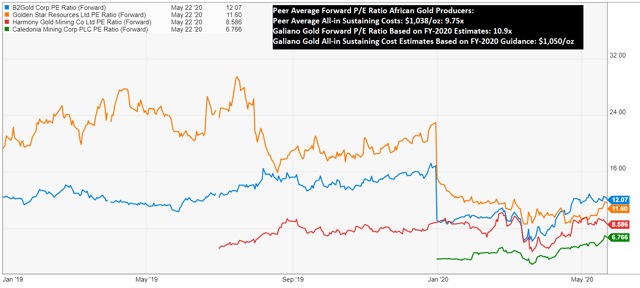
If we look at the above comparison of forward P/E ratios in B2Gold (BTG), Caledonia Mining (CMCL), Golden Star Resources (GSS), and Harmony Gold Mining (HMY), we can see that the average forward P/E ratio of the group is 9.75x. Based on Galiano Gold's share price of $1.20 and expected FY-2020 annual EPS of $0.11, the company is currently trading at a 10% premium to this average with a forward earnings multiple of 10.9. Currently, B2Gold, a million-ounce annual producer in Africa with diversification across several mines, all-in sustaining costs below $850/oz and a dividend, is trading just 12x forward earnings. Therefore, while some investors might argue that Galiano Gold is undervalued, and maybe this is the case, it's hard to say that the company is a better value than peers currently. Personally, I would much rather own a company like B2Gold with a growing dividend, less single-mine risk, and higher margins than Galiano Gold for a similar forward earnings multiple. To summarize, Galiano Gold might be cheap, but so are all of its peers that are more de-risked.
(Source: Company Presentation)
Galiano Gold had a solid first quarter and has maintained guidance despite the COVID-19 challenges, but the low costs some investors may be salivating over are not here to stay. While the company is reasonably valued at barely 11x forward earnings, this is a premium valuation compared to African producer peers that typically trade at high single-digit forward earnings multiples. Therefore, while a rising gold price may continue to lift Galiano Gold, I believe there are much more attractive opportunities elsewhere in the sector, both in Africa and in tier-1 jurisdictions.
Disclosure: I am/we are long GLD. I wrote this article myself, and it expresses my own opinions. I am not receiving compensation for it (other than from Seeking Alpha). I have no business relationship with any company whose stock is mentioned in this article.
Additional disclosure: Disclaimer: Taylor Dart is not a Registered Investment Advisor or Financial Planner. This writing is for informational purposes only. It does not constitute an offer to sell, a solicitation to buy, or a recommendation regarding any securities transaction. The information contained in this writing should not be construed as financial or investment advice on any subject matter. Taylor Dart expressly disclaims all liability in respect to actions taken based on any or all of the information on this writing.