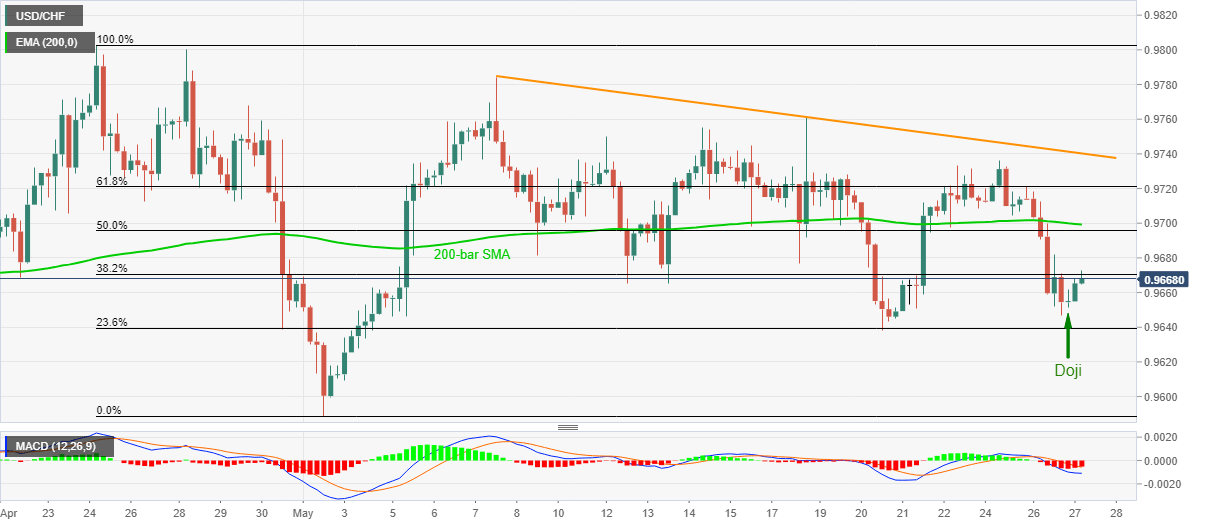
USD/CHF Price Analysis: Bullish Doji on H4 favors recovery above 0.9650
by Anil Panchal- USD/CHF recovers from 0.9652 following a bullish candlestick formation.
- 200-bar EMA, 61.8% Fibonacci retracement can check the pullback moves.
- Sustained break of 23.6% Fibonacci retracement will negate upside momentum.
USD/CHF portrays gradual recovery from the intraday low while taking the bids near 0.9670, up 0.13% on a day, during the pre-European session on Wednesday.
Considering the bullish Doji formation on the four-hour (H4) chart, odds of further upside towards a 200-bar EMA level of 0.9700 are high.
Should buyers manage to keep the reins past-0.9700, 61.8% Fibonacci retracement of April 24 to May 01 fall, around 0.9720, followed by a three-week-old falling trend line, near 0.9740, could question the bulls.
Alternatively, the pair’s declines below 0.9640, comprising 23.6% of Fibonacci retracement, could recall the bears targeting the monthly low near 0.9590.
USD/CHF four-hour chart

Trend: Further recovery expected
Additional important levels
| Overview | |
|---|---|
| Today last price | 0.9668 |
| Today Daily Change | 12 pips |
| Today Daily Change % | 0.12% |
| Today daily open | 0.9656 |
| Trends | |
|---|---|
| Daily SMA20 | 0.9702 |
| Daily SMA50 | 0.9705 |
| Daily SMA100 | 0.9687 |
| Daily SMA200 | 0.9784 |
| Levels | |
|---|---|
| Previous Daily High | 0.9721 |
| Previous Daily Low | 0.9647 |
| Previous Weekly High | 0.9761 |
| Previous Weekly Low | 0.9638 |
| Previous Monthly High | 0.9803 |
| Previous Monthly Low | 0.9595 |
| Daily Fibonacci 38.2% | 0.9675 |
| Daily Fibonacci 61.8% | 0.9693 |
| Daily Pivot Point S1 | 0.9628 |
| Daily Pivot Point S2 | 0.96 |
| Daily Pivot Point S3 | 0.9554 |
| Daily Pivot Point R1 | 0.9702 |
| Daily Pivot Point R2 | 0.9749 |
| Daily Pivot Point R3 | 0.9776 |